Enabling and configuring PMI Request Metrics
Request Metrics are enabled and configured globally for all appservers in the cell. For a single-server environment, the metrics are enabled and configured for all application servers residing on the local node.
The PMI Request Metrics component can be enabled, disabled, and configured at runtime, without having to restart each individual appserver in the cell.
To enable the PMI Request Metrics using the Administrative Console:
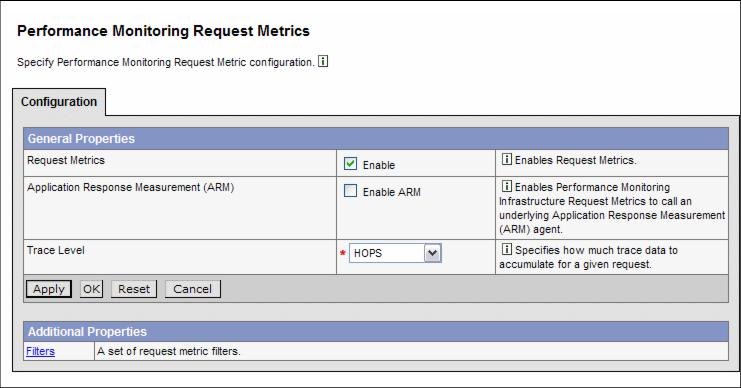
Figure 16-17 PMI Request Metrics configuration pane
As soon as Request Metrics are enabled and a trace level greater than NONE is specified and saved to the WebSphere configuration, trace records are written to the System.out JVM log for all appservers for any incoming Web or EJB request.
See the next section for a detailed description of the trace record format.
Important: In version 5.1, only remote EJB calls entering the RMI activity service are monitored by the PMI Request Metrics component. Hence a servlet calling a local EJB does not produce any metrics data for the bean. In future releases, different tracing levels will give more instrumentation. |
WebSphere is a trademark of the IBM Corporation in the United States, other countries, or both.
IBM is a trademark of the IBM Corporation in the United States, other countries, or both.