Class Statistics Table
The Class Statistics Table (see Figure 17-15) displays data for the classes with an ability to drill down to the method level.
The data in this view provides the next lower level of details, after the Package Statistics. It shows which classes are most commonly used, the execution time for methods and the size of the objects. This makes it easier to identify particular classes that require further investigation.
The information that is displayed is:
|
|
|
| Base Time (not displayed by default)
|
|
|
|
| Inherited Base Time (not displayed by default)
|
|
|
|
| Cumulative Time (not displayed by default)
|
|
|
|
| Inherited Cumulative Time (not displayed by default)
|
|
|
|
| Calls (not displayed by default)
|
|
|
|
| Inherited Calls (not displayed by default)
|
Note Information related to instance sizes is available only if you open the view with the Java Profiling Agent.
|
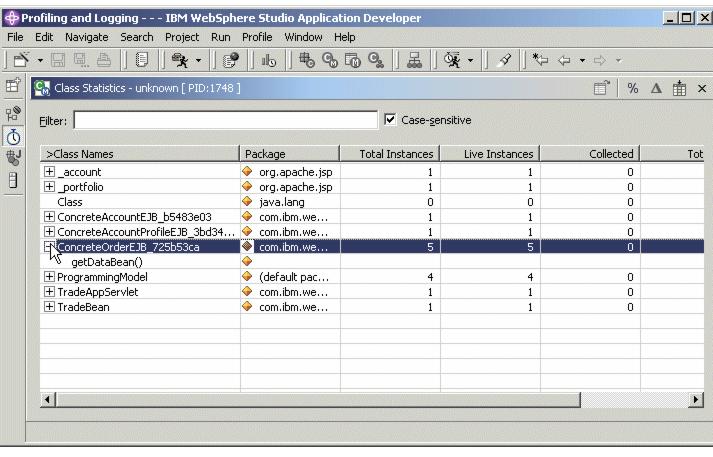
Figure 17-15 Class Statistics Table
Prev | Home | Next
WebSphere is a trademark of the IBM Corporation in the United States, other countries, or both.
IBM is a trademark of the IBM Corporation in the United States, other countries, or both.