About Tivoli Performance Viewer
The Tivoli Performance Viewer retrieves performance data by periodically polling the PMI service of the appserver that is being monitored. As all application servers host a PMI service, only one connection is created from the Tivoli Performance Viewer to the Deployment Manager in a cell, and PMI data from all servers flow through the Deployment Manager to the TPV. In addition, the Node Agent in a Network Deployment environment also hosts a PMI service for monitoring the running state of the physical machine. The performance data requested by Tivoli Performance Viewer is provided by the PMI service component by means of the Perf MBean residing in the application server's MBean server.
To minimize the performance impact, Tivoli Performance Viewer polls the server with the PMI data at an interval set by the user. All data manipulations are done in the Tivoli Performance Viewer client, which can be run on a separate machine, further reducing the impact. The Tivoli Performance Viewer's GUI provides controls that enable you to choose the particular resources and counters to include in the view. There are table and chart views available. You can also store retrieved data in a log file while viewing the data. This log file can later be used for replaying the scenario. The log file can have different formats, the preferred format is XML.
Figure 16-8 shows a high-level overview of how the Tivoli Performance Viewer collects data.
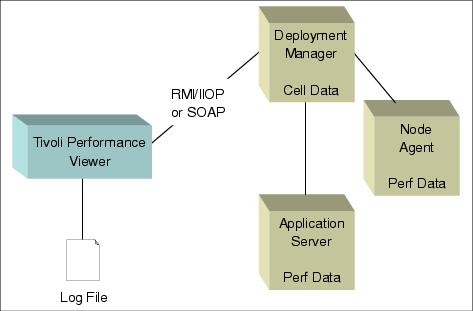
Figure 16-8 Tivoli Performance Viewer infrastructure overview
WebSphere is a trademark of the IBM Corporation in the United States, other countries, or both.
IBM is a trademark of the IBM Corporation in the United States, other countries, or both.
Tivoli is a trademark of the IBM Corporation in the United States, other countries, or both.