Debug the AssemblyLine
Tivoli Directory Integrator has a built-in AssemblyLine Debugger for walking through the execution of the Assembline, viewing and modifying data in-flight.
Click the Start Debug session button.
The AssemblyLine Data Stepper

The AssemblyLine Debugger offers two modes: the Data Stepper, which provides simple, straightforward testing features, and the advanced AssemblyLine Debugger where we can dig deeper - like stepping through scripts, interactively working with Java libraries and modifying data on-the-file.
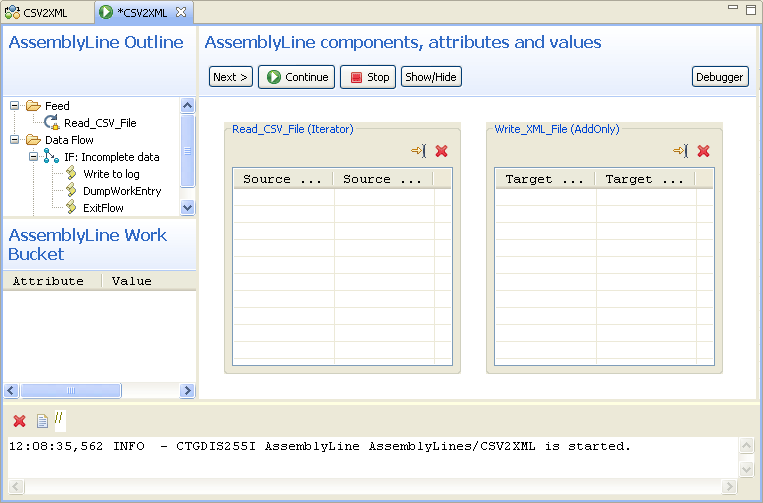
The Data Stepper is a useful tool for stepping through the execution of the AssemblyLine Connectors and viewing the data read, written and transformed. This screen is divided into three main areas:
- The AssemblyLine Outline shows your AL, highlighting where execution is paused;
- The AssemblyLine Work Bucket which displays all Attributes mapped into the Work Entry - that is, those found in Input Maps or Attribute Map components.
- AssemblyLine Components, Attributes and Values where we have a button row for controlling your debug session and a set of data display grids for all Connectors in the AssemblyLine.
Along the bottom we can see a Console output window that shows the same information that you got when you ran your AssemblyLine using the Run button.
At this point your AssemblyLine has been dispatched to the test Server and is ready to start running at your command. Press the Next button to begin stepping.
Stepping into the AssemblyLine run

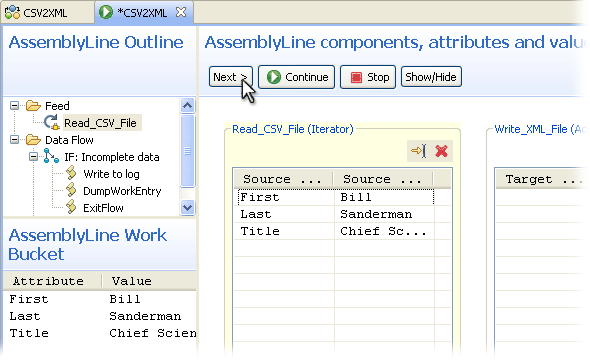
Notice how three things happen onscreen: the AssemblyLine Outline shows that the "Read_CSV_File" Connector is currently active; the AssemblyLine Work Bucket displays the Attributes just read by this Connector; and the data display grid for this Connector is also populated with these Attributes. Each time you press the Next button execution continues to the step and the information displays are refreshed.
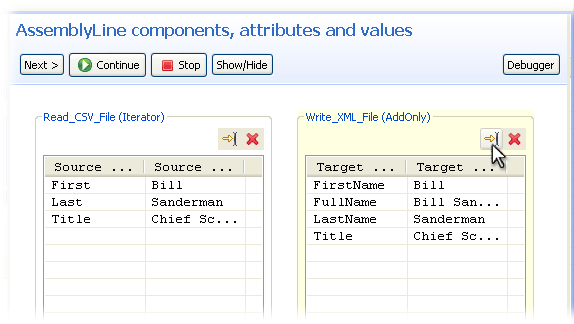
We can also use the Run To Here button at the top of the data grid for a Connector to jump to this point. Do this now for the "Write_XML_File" Connector.
Stepping to the Write_XML_File Connector

This data grid then displays the Attributes in the Output Map of this Connector along with their values - including the computed value for "FullName".
Now let's look at the Data Stepper toolbar buttons to see what options we have:
- Next > moves processing to the next component and updates all data display areas;
- Continue will cause your AssemblyLine to continue execution until it is finished;
- Stop terminates the run immediately;
- Show/Hide lets we decide which Connector data grids are displayed;
- Debugger switches you to Full Debugger mode where we can step through script code, set breakpoints, view and modify any Attributes and script variables, and interactively execute JavaScript commands in the context of the running AssemblyLine.
Although the Data Stepper provides a wealth of information about how your AssemblyLine will perform, sometimes we need the added power of the advanced Debugger. Note that we can switch between Stepper and Advanced modes as often as we want during a debugging session. Try it now by pressing the Debugger button located at the far right of the Data Stepper button row.
Advanced Debugger mode

When you switch modes the screen is redrawn to provide new controls for the AssemblyLine Outline and the AssemblyLine Work Bucket is replaced with the Watch List on the right side of the window. The Watch List shows the standard Attribute buckets: work and conn. There is also a folder called "Global variables" that if opened displays all variables defined for your AssemblyLine: both the built-in ones like work and system, plus any that you define in your script code. The last Watch folder is for our own use and we can add variables or entire JavaScript expressions that we want to watch by using the Edit Watch List button at the top of this panel.
Turning our attention to the AssemblyLine Outline, the boxes next to components in this tree-view are called Breakpoints and we can tell TDI to pause at any component during execution by clicking on one of these. We can also right-click on any node in and select Run and break here to bring AssemblyLine execution to this point. The toolbar above the outline gives you some of the same controls that you had in the Data Stepper, plus a couple of new ones:
Debugger buttons

Starting from the left these buttons are:
- Step Into which allows us to step into Attribute Maps, scripts and even into the underlying workflows of the AssemblyLine and its components. These waypoints in the built-in flows are called "Hooks" are covered in a later exercise;
- Step Over is the same as the Next > button you saw in the Data Stepper. In the Debugger it also lets you stop over script function calls instead of into them;
- Continue causes the AssemblyLine to run until completion (just like in the Data Stepper) or until a Breakpoint is reached;
- Stop halts your AssemblyLine, as it does in the Data Stepper;
- Clear All Breakpoints removes any Breakpoints that we have set for your AssemblyLine.
To get a feel for how Breakpoints work try setting one for the "Write to log" script by clicking in the box next to this component.
Setting a breakpoint

Now press the Continue button and your AssemblyLine will run until the IF-Branch is true and you find control at the "Write to log" Script. TDI also opens up a Script area allowing you to step through the code here. We can even set Breakpoints at any script line by double-clicking in the margin to the left of that line.
Setting a Breakpoint in script

Furthermore, we can double-click on any node in the component list to bring up the Debug display. As we can see in the figure above, there is a button titled Breakpoint Condition. We can use this to set a JavaScript expression that must evaluate to either true or false and which will determine if a Breakpoint is active or not. For example, the Breakpoint shown above could be set to be true if:
