WebSphere eXtreme Scale Administration Guide > Monitor the deployment environment > Monitoring performance with WebSphere Application Server PMI
|
| |
PMI modules
You can monitor the performance of the applications with the performance monitoring infrastructure (PMI) modules.
objectGridModule
The objectGridModule contains a time statistic: transaction response time. A transaction is defined as the duration between the Session.begin method call and the Session.commit method call. This duration is tracked as the transaction response time. The root element of the objectGridModule, "root", serves as the entry point to the WebSphere eXtreme Scale statistics. This root element has ObjectGrids as its child elements, which have transaction types as their child elements. The response time statistic is associated with each transaction type.Figure 1. ObjectGridModule module structure
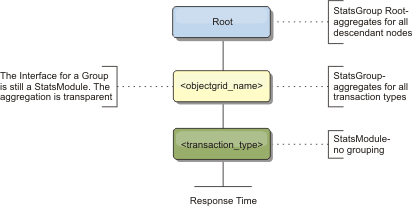 The following diagram shows an example of the ObjectGridModule
structure. In this example, two ObjectGrid instances exist in the
system: ObjectGrid A and ObjectGrid B. The ObjectGrid A instance has
two types of transactions: A and default. The ObjectGrid B instance
has only the default transaction type.
Figure 2. ObjectGridModule module structure example
 Transaction types are defined by application developers because
they know what types of transactions their applications use. The transaction
type is set using the following Session.setTransactionType(String) method:
/**
* Sets the transaction type for future transactions.
*
* After this method is called, all of the future transactions have the
* same type until another transaction type is set. If  no transaction
* type is set, the default  TRANSACTION_TYPE_DEFAULT transaction type
* is used.
*
* Transaction types are used mainly for statistical data tracking purpose.
* Users can predefine types of transactions that run in an
* application. The idea is to categorize transactions with the same characteristics
* to one category (type), so one transaction response time statistic can be
* used to track each transaction type.
*
* This tracking is useful when the application has different types of
* transactions.
* Among them, some types of transactions, such as update transactions, process
* longer than other transactions, such as read−only transactions. By using the
* transaction type, different transactions are tracked by different statistics,
* so the statistics can be more useful.
*
* @param tranType the transaction type for future transactions.
*/
void setTransactionType(String tranType);
The following example sets transaction type to updatePrice:
// Set the transaction type to updatePrice
// The time between session.begin() and session.commit() will be
// tracked in the time statistic for "updatePrice".
session.setTransactionType("updatePrice");
session.begin();
map.update(stockId, new Integer(100));
session.commit();
The first line indicates that the subsequent transaction type is updatePrice. An updatePrice statistic exists under the ObjectGrid instance that corresponds to the session in the example. Using Java™ Management Extensions (JMX) interfaces, you can get the transaction response time for updatePrice transactions. You can also get the aggregated statistic for all types of transactions on the specified ObjectGrid instance.
mapModule
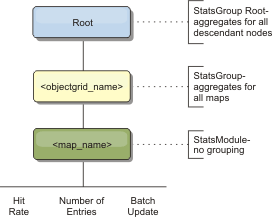
The mapModule contains three statistics that are related to eXtreme Scale maps:- Map hit rate - BoundedRangeStatistic: Tracks the hit rate of a map. Hit rate is a float value between 0 and 100 inclusively, which represents the percentage of map hits in relation to map get operations.
- Number of entries-CountStatistic: Tracks the number of entries in the map.
- Loader batch update response time-TimeStatistic: Tracks the response time that is used for the loader batch-update operation.
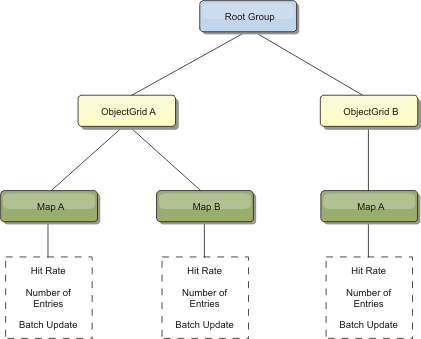
The root element of the mapModule, "root", serves as the entry point to the ObjectGrid Map statistics. This root element has ObjectGrids as its child elements, which have maps as their child elements. Every map instance has the three listed statistics. The mapModule structure is shown in the following diagram:
Figure 3. mapModule structure
 The following diagram shows an example of the mapModule structure:
Figure 4. mapModule module structure example
hashIndexModule
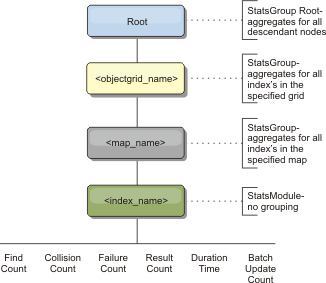
The hashIndexModule contains the following statistics that are related to Map-level indexes:- Find Count-CountStatistic: The number of invocations for the index find operation.
- Collision Count-CountStatistic: The number of collisions for the find operation.
- Failure Count-CountStatistic: The number of failures for the find operation.
- Result Count-CountStatistic: The number of keys returned from the find operation.
- BatchUpdate Count-CountStatistic: The number of batch updates against this index. When the corresponding map is changed in any manner, the index will have its doBatchUpdate() method called. This statistic will tell you how frequently the index is changing or being updated.
- Find Operation Duration Time-TimeStatistic: The amount of time the find operation takes to complete
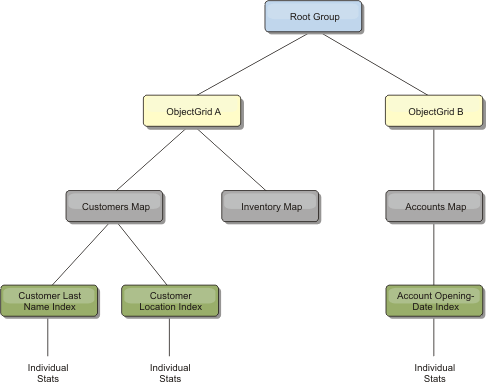
The root element of the hashIndexModule, "root", serves as the entry point to the HashIndex statistics. This root element has ObjectGrids as its child elements, ObjectGrids have maps as their child elements, which finally have HashIndexes as their child elements and leaf nodes of the tree. Every HashIndex instance has the three listed statistics. The hashIndexModule structure is shown in the following diagram:
Figure 5. hashIndexModule module structure
 The following diagram shows an example of the hashIndexModule
structure:
Figure 6. hashIndexModule module structure example
agentManagerModule
The agentManagerModule contains statistics that are related to map-level agents:- Reduce Time: TimeStatistic - The amount of time for the agent to finish the reduce operation.
- Total Duration Time: TimeStatistic - The total amount of time for the agent to complete all operations.
- Agent Serialization Time: TimeStatistic - The amount of time to serialize the agent.
- Agent Inflation Time: TimeStatistic - The amount of time it takes to inflate the agent on the server.
- Result Serialization Time: TimeStatistic - The amount of time to serialize the results from the agent.
- Result Inflation Time: TimeStatistic - The amount of time to inflate the results from the agent.
- Failure Count: CountStatistic - The number of times that the agent failed.
- Invocation Count: CountStatistic - The number of times the AgentManager has been invoked.
- Partition Count: CountStatistic - The number of partitions to which the agent is sent.
The root element of the agentManagerModule, "root", serves as the entry point to the AgentManager statistics. This root element has ObjectGrids as its child elements, ObjectGrids have maps as their child elements, which finally have AgentManager instances as their child elements and leaf nodes of the tree. Every AgentManager instance has the three listed statistics.
Figure 7. agentManagerModule structure
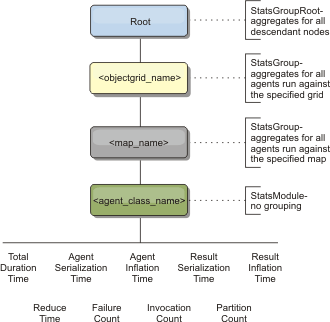
Figure 8. agentManagerModule structure example

queryModule
The queryModule contains statistics that are related to eXtreme Scale queries:- Plan Creation Time: TimeStatistic - The amount of time to create the query plan.
- Execution Time: TimeStatistic - The amount of time to run the query.
- Execution Count: CountStatistic - The number of times the query has been run.
- Result Count: CountStatistic - The count for each the result set of each query run.
- FailureCount: CountStatistic - The number of times the query has failed.
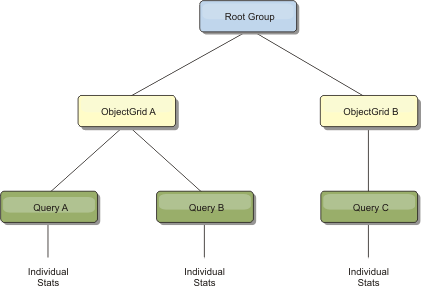
The root element of the queryModule, "root", serves as the entry point to the Query Statistics. This root element has ObjectGrids as its child elements, which have Query objects as their child elements and leaf nodes of the tree. Every Query instance has the three listed statistics.
Figure 9. queryModule structure
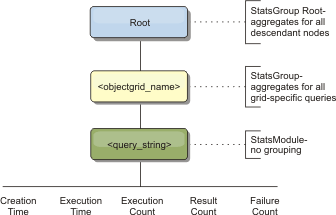
Figure 10. QueryStats.jpg queryModule structure example
Parent topic
Monitor performance with WebSphere Application Server PMIRelated concepts
Related tasks
Monitor performance with WebSphere Application Server PMI
Use the xsAdmin sample utility