View the playback summary of a virtual user
Overview
The Event Log page in the Protocol Data view provides a summary of what happened during an HTTP test run. A complete summary is always available for a test. The information available for a schedule depends on its logging level. The amount of information that you see in the Event Log depends on the amount of information that is collected by the test log. When you run a test, all logging is automatically enabled, therefore the Event Log contains complete details.When you run a schedule, however, you select a Log Level setting, and the amount of detail that the Event Log contains depends on this setting.
If schedule run is not large, select the setting All for all types of events. For large schedule runs, do not use the All setting, because of the time and space required to transfer large amounts of log detail to computer after a run is completed. Instead, define a special schedule for debugging tests with the log levels set to All. Limit this schedule to a single test (or a small number of tests) and to a small number of user groups or loop iterations. After you are satisfied that a test is performing correctly, you can move it to a schedule that emulates a realistic workload.
View the Event Log information
- In the Test Navigator, open a schedule or test.
- Run the schedule or test:
-
Run | Run As | Performance Test or Performance Schedule
- In the Protocol Data view, click the Event Log tab.

If you are running a test, the Event Log page is immediately populated.
If you are running a schedule, wait until the run is complete.
- Right-click on the report and select Display test log.
- Select a virtual user in the test log.
The Event Log page shows the summary of events for that user.
The first column has an arrow to indicate the page that is currently displayed in the other Protocol Data view windows:
- Request
- Response Headers
- Response Content
- Browser
The second column shows the status of the page:
Symbol Meaning Green check All requests for the page are successful and that there are no warnings. Red X Page contains requests with failed verdicts or unexpected response codes. Typically, failed verdicts are verification point failures. Unexpected response codes are codes outside the 200 and 300 range that were not recorded as such or that are not represented in associated verification points.
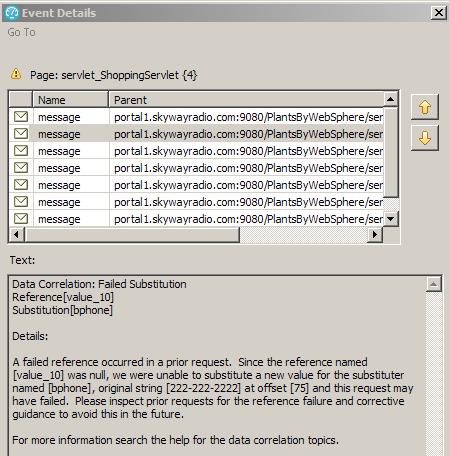
Yellow warning symbol Page contains messages but no failure verdicts or unexpected response codes. - Double-click an entry in the Event Log to open the Event Details window.
The Event Details window shows a list of events for the page that is highlighted in the Event Log. The Name and Parent columns show the name and parent request for each event. The Text field shows details for each event.

The Go To menu at the top of the Event Details window lets you jump to the corresponding event in the test or the test log. This is useful for obtaining more contextual information about the error shown in the table.
- Leave the Event Details window open, and click other pages in the Event Log, or use the Forward and Back buttons to navigate to other pages in the Event Log.
The Event Details window is updated to show the events for the page that is selected in the Event Log.
What to do next
The information in the Event Details window supplements the information in the test log. To see more information about a particular event, view the test log after the test finishes running. With the test log, you can see an event in context.
The test log also provides links to the recorded test.
Related
- HTTP debugging overview
- Watch a virtual user during a test run
- Watch a virtual user during a schedule run
- Replay a virtual user after a run completes
- Inspect HTTP test logs in the Protocol Data view
- Manage HTTP information in the Protocol Data view
- Viewing test logs