Transaction report
Overview
The Transaction report...- Summarizes the success of transactions in the run
- Graphs the response trend of each transaction during a specific sample interval
- Shows the transaction throughput
To display the report, in the Performance Test Run view, right-click "All Hosts" and select Display Transaction Report
![]()
The transaction report graphs sample intervals within a run. You set the Statistics sample interval value in the schedule, as a schedule property.
Overall page
The Overall Transaction Rate graph shows the average execution time for all transactions during a specific sample interval.![]()
Execution time is the actual time spent within the transaction container. If you have set staged loads in the schedule, this graph also delineates the stages with time range markers, in various colors, at the top.
The table under the graph lists the following information:
- The average execution time for all transactions in the entire run.
- The standard deviation of the average execution time. The standard deviation tells you how tightly the data is grouped about the mean.
For example, System A and System B both have an average execution time of 12 ms. However, this does not mean that the execution times are similar. System A might have execution times of 11, 12, 13, and 12 ms. System B might have execution times of 1, 20, 25, and 2. Although the mean time is the same, the standard deviation of System B is greater—and the execution time is more varied.
- The longest transaction in the entire run.
- The shortest transaction in the entire run.
Elapsed Time vs. Time
The Elapsed Time vs. Time graph shows the average response of each transaction during a specific sample interval.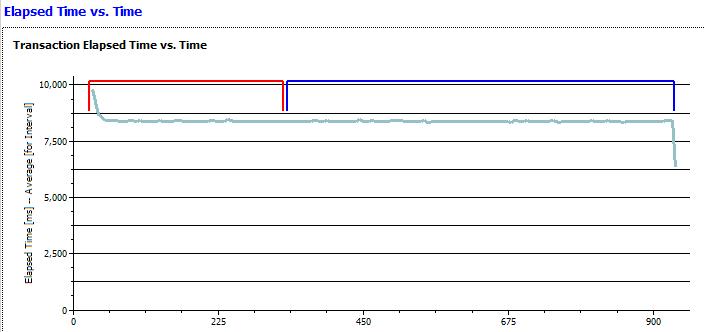
Each transaction is represented by a separate line. If you have set staged loads in the schedule, this graph also delineates the stages with time range markers, in various colors, at the top.
The table under the graph lists the following information for each transaction:
- The minimum execution time for the entire run.
- The average execution time for the entire run. This is similar to the graph, but the information in the table is the average for the entire run rather than the average per sample interval.
- The standard deviation of the average response time. The standard deviation tells you how tightly the data is grouped about the mean.
For example, System A and System B both have an average response time of 12 ms. However, this does not mean that the response times are similar. System A might have response times of 11, 12, 13, and 12 ms. System B might have response times of 1, 20, 25, and 2. Although the mean time is the same, the standard deviation of System B is greater—and the response time is more varied.
- The maximum execution time for the entire run.
- The rate, per second, at which the transaction was completed.
- The number of attempts for the transaction.
Transaction Throughput page
These line graphs provide an overview of the transaction frequency and the number of users that are adding load, both over the course of a run.
![]()
- The Transaction Hit Rate graph shows the overall rates for starting and completing transactions during a specified sample interval. If you have set staged loads in the schedule, this graph also delineates the stages with time range markers, in various colors, at the top. The summary table under the graph lists the transaction rate per second and the number of transactions that were completed for the entire run.
- The User Load graph shows the number of active users and the number of users that completed testing over the course of the run. The summary table under the graph lists the number of active users, the number of users that completed testing, and the total number of users for the latest sample interval.