Page Element report
Content
- Overview
- Overall page
- Response vs. Time Summary page
- Response vs. Time Detail page
- Page Element Throughput page
- Server Health Detail page
- Related
Overview
The Page Element Report report summarizes the most important page element data for the run.
To access, in the Performance Test Runs view, right click and select Display Report...

Select...
-
HTTP Reports | Page Element Report

The graphs in this report show...
| Interval | Depends on the Statistics sample interval value set for the schedule. |
| Attempts | A request was sent. |
| Hits | Server received the request and returned any response. |
| Success | Response code verification point passed for that request. |
If the request has no verification point, a success means that the server received a request and returned a response where the status code was in the 200 or 300 category, or returned an expected response in the 400 or 500 category.
The response time is the time between the first request character sent and the last response character received.
The response time does not include HTTP requests that time out or requests that return a status code in the range of 4XX (client errors) - 5XX (server errors) or requests that timed out.
Response times for HTTP requests that time out or that return an unexpected status code (the recorded and played back codes do not match) in the range of 4XX (client errors) to 5XX (server errors) are discarded from the reported values.
Overall page
The Overall line graph shows the average response time for all page elements during a specified interval.
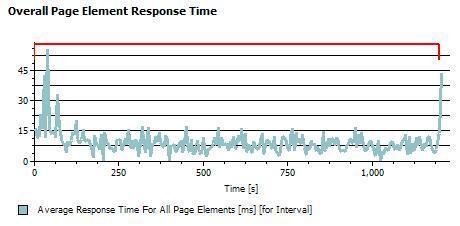
When you have set staged loads in the schedule, this graph delineates the stages with time range markers, in various colors, at the top.
The table after the graph provides the following information:
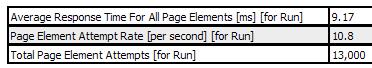
- Average response time for all page elements in the entire run
- Standard deviation of the average response time.
The standard deviation tells you how tightly the data is grouped about the mean. For example, System A and System B both have an average response time of 12 ms. However, this does not mean that the response times are similar. System A might have response times of 11, 12, 13, and 12 ms. System B might have response times of 1, 20, 25, and 2. Although the mean time is the same, the standard deviation of System B is greater—and the response time is more varied.
- Average number of page elements attempted for the entire run
- Total page element attempts for the entire run
Response vs. Time Summary page
The Response vs. Time Summary line graph shows the response time for the 10 slowest page elements in the run.
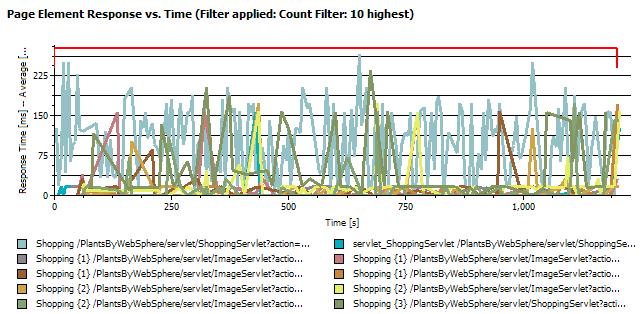
Stages are indicated with time range markers, in various colors, at the top.
The table after the graph lists the parent page and the page element, and provides the following information:
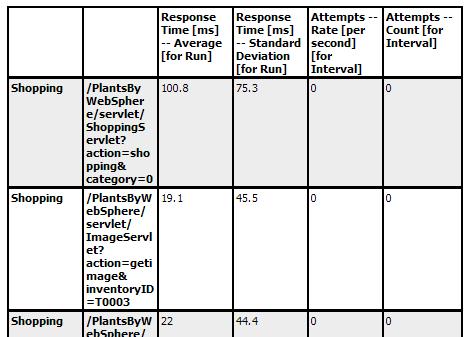
- The average response time for that page element during the entire run
- The standard deviation of the average response time.
The standard deviation tells you how tightly the data is grouped about the mean.
For example, System A and System B both have an average response time of 12 ms. However, this does not mean that the response times are similar. System A might have response times of 11, 12, 13, and 12 ms. System B might have response times of 1, 20, 25, and 2. Although the mean time is the same, the standard deviation of System B is greater—and the response time is more varied.
- The attempts per second during the most recent sample interval
- The number of attempts during the most recent sample interval
Response vs. Time Detail page
The Response vs. Time Detail page shows the response time for each page element in the run.
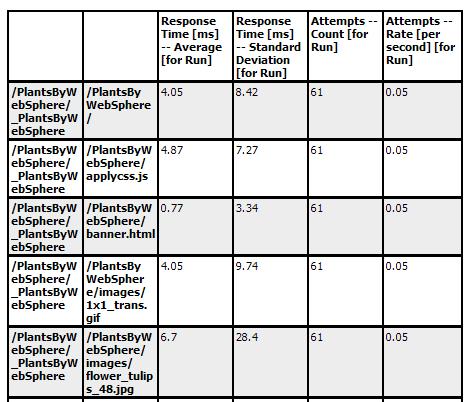
The table lists the parent page and page element, and provides the following information for each page element in the entire run:
- The average response time
- The standard deviation of the average response time.
The standard deviation tells you how tightly the data is grouped about the mean.
For example, System A and System B both have an average response time of 12 ms. However, this does not mean that the response times are similar. System A might have response times of 11, 12, 13, and 12 ms. System B might have response times of 1, 20, 25, and 2. Although the mean time is the same, the standard deviation of System B is greater—and the response time is more varied.
- The number of attempts
- The number of attempts per second
Page Element Throughput page
The Page Element Throughput page shows the average response trend during a specified interval. It contains two line graphs with corresponding summary tables:
The Page Element Hit Rate graph shows the combined attempt rate and hit rate for all page elements during the last recorded interval.
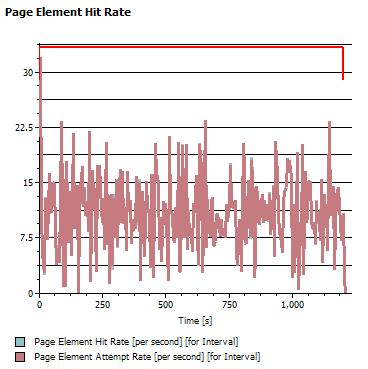
Colored time-range markers at the top of the graph delineate the stages.
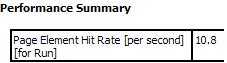
The table after the graph lists the average hit rate for all pages in the run.
The User Load graph shows active users compared to users that have completed testing.
The table after the graph lists...
- Number of active users
- Number of users that have completed testing
- Total user count for the entire run
Server Health Detail page
The Server Health Detail bar chart shows the percentage of successes for the 10 slowest page elements in the run.
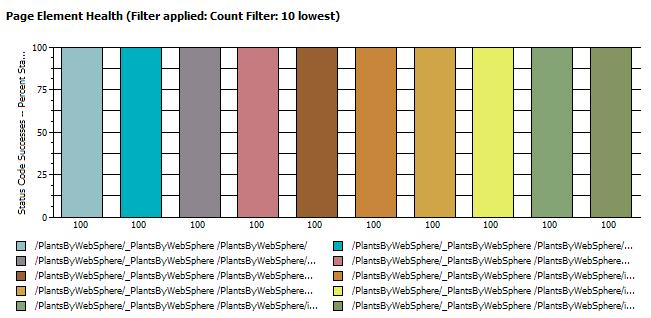
The table under the chart lists the parent page and page element, and provides the following information for the entire run:
- The number of attempts
- The number of hits
- The number of successes
- The percent of successes (matches the information in the bar chart)
- The number of attempts per second
Related