Customize the appearance of report graphs
Overview
You can change the appearance of reports.- table
- bar chart
- line chart
To apply the change to all instances of that report, save the report. You can also change certain defaults.
Customize the appearance of a report graph
- In the Test Navigator, expand the project until you locate the run.
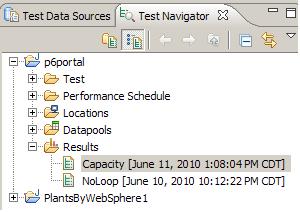
Each run begins with the name of the schedule or test, and ends with the date of the run in brackets.
- Double-click the run. The default report opens.
- Right-click the graph to modify, and then click Customize.

- The controls in the Graphic Configuration window differ depending on the graphic type:
- bar chart
- line chart
- table
Here is bar chart example...

Here is table example...

Here is line chart example...
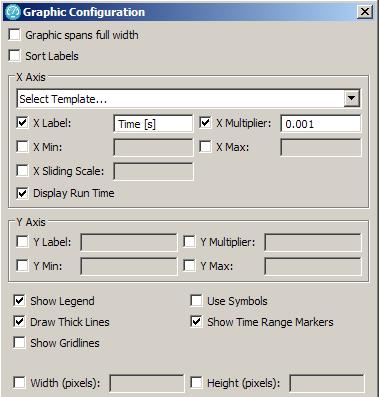
For each graphic type, only the applicable controls are displayed. You can adjust the following controls:
Option Description Graphic spans full width Force the graphic to use the entire width of the view. Sort labels Sort the data alphabetically by label (left to right for charts, top to bottom for tables). X Label Edit the default X axis label Line charts only
X Multiplier Change the multiplier value for the X axis Line charts only
X Min Change the minimum value displayed on the X axis Line charts only
X Max Change the maximum value displayed on the X axis Line charts only
X Sliding Scale See a "window" of data displayed on the X axis. Useful when viewing results during a test run For example, setting the X Sliding Scale to 600 would restrict the report to displaying only the previous 10 minutes of data based on the current time or the run finish time.
Line charts only.
Display Run Time By default Display Run Time is selected so that the time at the start of the test is displayed as zero. Clear to display time in UNIX epoch format (the number of milliseconds since the UNIX epoch on January 1, 1970) Line charts only
Summary Table Collapse the table to summary style. Because this removes column headings, this is useful only for tables where the row label completely describes the corresponding values Tables only
Sort Columns Sort the columns left to right alphabetically by header label Tables only
Invert Table Rows/Columns Swap the columns and rows in the table Tables only
Y Label Edit the default Y axis label Charts only
Y Multiplier Change the multiplier value for the Y axis Charts only
Y Min Change the minimum value displayed on the Y axis Charts only
Y Max Change the maximum value displayed on the Y axis Charts only
Show Legend Disable the chart legend, which matches data labels with the colors or geometric shapes of the displayed data Charts only
Use Symbols Display symbols at data points; clear to remove symbols. Line charts only
Click...
Window | Preferences | Test | Performance Test Reports | Use symbols on line chart
Draw Thick Lines Display thick graph lines; clear to display thin graph lines Line charts only).
Show Time Range Markers Display vertical markers between the user load stages of a schedule Line charts only).
Show Gridlines Display vertical grid lines Line charts only
Use Thin Bars Display graph bars that do not touch; clear to display graph bars that touch (bar charts only). Click... - Window | Preferences | Test | Performance Test Reports | Use thin bars on bar chart
Use 3D Bars Enable three-dimensional bars (bar charts only). Click
Window | Preferences | Test | Performance Test Reports | Use 3D bars on bar chart and pie chart.
Height Specify the graphic height in pixels Charts only). Note that if you enter a value that is too small, the graphic might not be displayed at all.
Width Specify the graphic width in pixels Charts only.
Note that if you enter a value that is too small, the graphic might not be displayed at all.
Example
The scope of the change depends on whether you change one report only, save the report, or change the report preferences. Assume to make bar graphs three dimensional:
- To change one bar chart for one session, select the report, click Customize, and select Use 3D Bars.
- To change each instance of a bar chart, select the report, click Customize, select Use 3D Bars, and save the report.
For example, if you change the Overall bar chart in the HTTP report and then save it, each Overall bar chart in each HTTP report is changed.
- Click...
-
Window | Preferences | Test | Performance Test Reports | Use 3D bars on bar chart and pie chart