Use IBM Rational Performance Tester: Resource monitoring Part 4, Monitoring with IBM Tivoli Monitoring
Components of IBM Tivoli Monitoring
- hub
- remote
- desktop
- browser
| Tivoli Enterprise Monitoring Server | Collection and control point for alerts received from the agents, and collects their performance and availability data. There are two types of monitoring servers:
|
| Tivoli Enterprise Portal Server | Placed between the client and the monitoring server. Enables retrieval, manipulation, and analysis of data from the agents. |
| Tivoli Enterprise Portal Client | Java-based user interface for monitoring the enterprise. Tivoli Enterprise Portal offers two modes of operation:
|
| Monitoring Agents | Installed on the systems to monitor. These agents collect and distribute data to a monitoring server. |
| Tivoli Data Warehouse | Stores historical data collected from agents in your environment.
The data warehouse is located on a DB2, Oracle, or Microsoft SQL Server database. To collect information to store in this database, install the Warehouse Proxy agent. To perform aggregation and pruning functions on the data, install the Warehouse Summarization and Pruning agent. |
| Tivoli Enterprise Console | Event synchronization component for synchronizing the status of situation events that are forwarded to the event server. When the status of an event is updated because of Tivoli Enterprise Console rules or operator actions, the update is sent to the monitoring server, and the updated status is reflected in both the Situation Event Console and the Tivoli Enterprise Console event viewer. |
Monitoring agents
Today, there are over one hundred ITM monitoring agents available from IBM and third-party software vendors. Each agent is responsible for data collection from systems, subsystems, or applications. The collected data is passed from the monitoring agents to the portal server through the monitoring server. An agent interacts with a single system or application and, in most cases, resides on the same computer where the system or application is running. There are two types of monitoring agents:
- Operating system (OS) agents that monitor the availability and performance of the computers in your monitoring environment. An example of an OS agent is the Monitoring Agent for Windows OS, which monitors Windows XP, Windows 2000, and Windows 2003 operating systems.
- Other agents (referred to as application agents or non-OS agents) that monitor the availability and performance of systems, subsystems, and applications. An example of a non-OS agent is IBM Tivoli Monitoring for Microsoft Exchange, which monitors the Microsoft Exchange Server.
IBM Tivoli Monitoring also provides a customized agent called the Universal Agent. The Universal Agent can monitor any data that is collectable in a given environment. For example, the Universal Agent can monitor the status of your company website to ensure that it is available.
Agents run on z/OS, UNIX, Windows XP Professional Edition, Windows 2000, Windows 2003 Server, HP-UX however, not all agents are supported on all platforms.
Each agent has special metadata that describes itself. This metadata is required when integrating data collection into a custom client, such as Rational Performance Tester. Today, Performance Tester is capable of data collection from the following ITM Monitoring Agents:
- Operating system agents
- Monitoring Agent for Windows OS
- Monitoring Agent for Linux OS
- Monitoring Agent for UNIX OS
- Monitoring Agent for z/OS
- Application agents
- Monitoring Agent for Citrix
- Monitoring Agent for IBM DB2
- Monitoring Agent for IBM Tivoli Composite Application Manager for WebSphere
- Monitoring Agent for IBM WebSphere Application Server
- Monitoring Agent for IBM WebSphere MQ
- Monitoring Agent for Oracle Database
- Monitoring Agent for SNMP-MIB2 (only)
Data collection
Retrieving data from ITM is accomplished by making Simple Object Access Protocol (SOAP) requests to the embedded SOAP server contained within the Tivoli Enterprise Monitoring Server. It is important to note that in the IBM Tivoli Monitoring documentation, the SOAP server is often referred to as a Web service, even though there is no Web Service Definition Language (WSDL) publicly published.
Once data is retrieved using SOAP requests, the well formed XML responses are transformed into the Eclipse Test and Performance Tools Platform (TPTP) statistical model format. This model format is based on the Eclipse Modeling Framework (EMF) and is designed as a generic method of storing and representing statistical data, despite which system or data collector the data points are observed from. The generic model format allows Performance Tester and other Eclipse-based views to render reports based on this data.
As each event (a statistical data point) is observed, it is transformed into a TPTP Statistical model event on-the-fly. This event is then loaded into the TPTP Data Loader, which persists the event and triggers any registered user interfaces to update based on this new event.
The integration between Performance Tester and IBM Tivoli Monitoring...

There are two mechanisms by which statistical data can be collected from ITM:
- Real-time: Real-time data collection requires making SOAP requests to the monitoring server requesting for the most recently acquired data point.
- Importing historically: Importing historical statistical data is possible because ITM is a managed solution, where the data observed over time is persisted to the Tivoli Data Warehouse.
A SOAP request to the monitoring server consists of:
- Constructing an XML fragment that corresponds to one of the SOAP methods described in the ITM documentation. Refer to the Administering OMEGAMON Products document located at: http://publib.boulder.ibm.com/tividd/td/IBMTivoliCandleNetPortal1.9.5lnk.html
- Sending the XML fragment as the entity-body of an HTTP POST request to the URL: http://<MONITORING_SERVER>:1920///cms/soap/kshhsoap.htm
- <MONITORING_SERVER> refers to the name of the host on which the monitoring server process is running.
- The three slashes (///) in the URL are required by the monitoring server.
- Setting the following properties in the HTTP header:
- interfacename
- CT_SOAP
- messagetype: Call
Here is a sample HTTP POST request that can be used to query ITM for some data.
Sample HTTP POST request
POST http://localhost:1920///kdsmain/soap HTTP/1.0
Accept: */*
Accept-Language: en-us
Referer: http://localhost:1920///kdsmain/soap/kshhsoap.htm
interfacename: CT_SOAP
messagetype: Call
Content-Type: text/xml
Proxy-Connection: Keep-Alive
User-Agent: Mozilla/4.0 (compatible; MSIE 6.0; Windows NT 5.1;
 .NET CLR 1.1.4322;.NET CLR 1.0.3705)
Host: localhost:1920
Content-Length: 96
Pragma: no-cache

    <CT_Get><userid>sysadmin</userid><password></password>
    <object>Web_Applications</object></CT_Get>
- CT_Get is a command that the ITM SOAP server understands and declares the opening of a new transaction query.
- userid and password are used for authenticating with the SOAP server.
- object refers to the ITM object name for which we are querying (explained in more detail in the next section). In order to get the available agents, the ITM Object name is set to ManagedSystem.
Types of queries
In this section we list three types of queries.
Query monitor agents
Querying for monitoring agents that are available to the indicated monitoring server and collecting data:
Example monitoring agent query
<CT_Get><userid>sysadmin</userid><password></password>
    <object>ManagedSystem</object>
</CT_Get>
Example response
<?xml version="1.0" encoding="ISO-8859-1"?>
<SOAP-ENV:Envelope xmlns:SOAP-ENV="http://schemas.xmlsoap.org/soap/envelope/"
SOAP-ENV:encodingStyle="http://schemas.xmlsoap.org/soap/encoding/">
<SOAP-ENV:Body><SOAP-CHK:Success xmlns:SOAP-CHK = "http://soaptest1/soaptest/"
xmlns="urn:candle-soap:attributes">
<TABLE name="O4SRV.INODESTS">
<OBJECT>ManagedSystem</OBJECT>
<DATA>
<ROW>
<Timestamp>1050620105552004</Timestamp>
<Name>RDANEK:UA</Name>
<Managing_System>HUB_RDANEK</Managing_System>
<ORIGINNODE>RDANEK:UA</ORIGINNODE>
<Reason>FA</Reason>
<Status>*OFFLINE</Status>
<Product>UM</Product>
<Version>04.10.00</Version>
<Type>V</Type>
<HLOCFLAG>L</HLOCFLAG>
<HHOSTINFO>WinXP~5.1-SP1</HHOSTINFO>
<HHOSTLOC></HHOSTLOC>
<CT_Host_Address>ip:#169.254.198.66[38213]
<NM>RDANEK</NM></CT_Host_Address>
</ROW>
</DATA>
</TABLE>
</SOAP-CHK:Success></SOAP-ENV:Body></SOAP-ENV:Envelope>
The response is returned in a well-formed XML document structure. Now let us dissect the response:
- The OBJECT element echoes the same ITM object name that was sent in the initial SOAP.
- The DATA contains the result data of the query, which is of most interest to us. Each separate XML fragment of data is enclosed in a ROW element.
- Within each ROW element are the attributes which are known about for the given object. For example, Timestamp, Name, Managing_System, are some of the available attributes.
- The NAME element contains the name of the monitoring agent.
- The CT_Host_Address contains the host and/or address on which the Monitoring Agent is running.
Query recent data
Querying for recent data allows clients to retrieve the most recently acquired statistical data point by the monitoring server for a monitoring agent. This query would be used in the live monitoring scenario where periodically the statistical model is updated with new data points:
<CT_Get><userid>sysadmin</userid><password></password>
    <target>Primary:RDANEK:NT</target>
    <object>NT_Process</object>
    <attribute>Thread_Count</attribute>
    <afilter>ID_Process;EQ;988</afilter>
</CT_Get>
- A TARGET is the name of the monitoring agent as returned in the NAME element when querying for the available agents on a monitoring server.
- An OBJECT indicates the ITM Object that is being queried for data. This element is similar to a performance object in the Windows Management Infrastructure (WMI).
- (optional) ATTRIBUTE elements are the Performance Counters belonging to the ITM object (or performance object). For example, the NT_Process object has attributes named Process Name, % Processor time, % User Time. By specifying one or more attributes, one limits the results returned to the specified attributes.
- Filters, indicated by the AFILTER element, allow the query to specify the values of attributes for which the query should return data for. For example, when querying the NT_Process object, one may only want data for a certain process.
This example query returns the value of thread count for the process with an identifier of 988.
Example data query response
<?xml version="1.0" encoding="ISO-8859-1"?>
<SOAP-ENV:Envelope xmlns:SOAP-ENV="http://schemas.xmlsoap.org/soap/envelope/"
  SOAP-ENV:encodingStyle="http://schemas.xmlsoap.org/soap/encoding/">
   <SOAP-ENV:Body><SOAP-CHK:Success xmlns:SOAP-CHK = "http://soaptest1/soaptest/"
         xmlns="urn:candle-soap:attributes">
    <TABLE name="KNT.WTPROCESS">
    <OBJECT>NT_Process</OBJECT>
        <DATA>
        <ROW>
        <Thread_Count dt="number">24</Thread_Count>
        </ROW>
        </DATA>
    </TABLE>
</SOAP-CHK:Success></SOAP-ENV:Body></SOAP-ENV:Envelope>
The response is returned in a well-formed XML document structure. Now let us dissect the response:
- The OBJECT element echo's the same ITM Object name that was sent in the initial SOAP.
- The DATA contains the result data of the query, which is of most interest to us. Each separate XML fragment of data is enclosed in a ROW element. In the example response, the value of the Thread count for the NT_Process object matching the process with an identifier of 988 is 24.
Query historical data
Querying for historical data allows the retrieval of statistical observations collected in the past for a monitoring agent. In order for this type of data collection to be enabled, historical data collection must have been configured for the desired monitoring agent through the monitoring server. The queries are identical to the preceding section except that we specify an additional tag in the query: <history>Y</history>:
<CT_Get><userid>sysadmin</userid><password></password>
    <target>Primary:RDANEK:NT</target>
    <object>NT_Process</object>
    <attribute>Timestamp</attribute>
    <attribute>Thread_Count</attribute>
    <history>Y</history>
    <afilter>Timestamp;GE;1050620132400000</afilter>
</CT_Get>
This query will return the thread count for all observations after June 20th, 2005 at 1:24 PM. A filter is used to specify a timestamp in order to only retrieve the historical data for the time period that is of interest. Querying for historical data without a timestamp filter will result in the SOAP server returning all historical data and this can overwhelm the system resources.
The timestamp is of the format CYYMMDDHHMMSSmmm:
- C is the century guard
- YY is the year
- First MM is the month
- DD is the day
- HH is the hour
- Second MM is the minute
- SS is the seconds
- mmm is the milliseconds
Example historical data response
<?xml version="1.0" encoding="ISO-8859-1"?>
<SOAP-ENV:Envelope xmlns:SOAP-ENV="http://schemas.xmlsoap.org/soap/envelope/"
  SOAP-ENV:encodingStyle="http://schemas.xmlsoap.org/soap/encoding/"
    > <SOAP-ENV:Body><SOAP-CHK:Success xmlns:SOAP-CHK =
     "http://soaptest1/soaptest/"xmlns="urn:candle-soap:attributes">
<TABLE name="KNT.WTPROCESS">
    <OBJECT>NT_Process</OBJECT>
    <DATA>
        <ROW>
        <Timestamp>1050620132453887</Timestamp>
        <Thread_Count dt="number">1</Thread_Count>
        </ROW>
        <ROW>
        <Timestamp>1050620132453887</Timestamp>
        <Thread_Count dt="number">64</Thread_Count>
        </ROW>
        <ROW>
        <Timestamp>1050620132453887</Timestamp>
        <Thread_Count dt="number">3</Thread_Count>
        </ROW>
    </DATA>
</TABLE>
</SOAP-CHK:Success></SOAP-ENV:Body></SOAP-ENV:Envelope>
Configuring a performance schedule
For further information on configuring resource monitoring using IBM Tivoli Monitoring, see Resource monitoring using IBM Rational Performance Tester: Part 1, Scheduling and reporting.
To configure resource monitoring using IBM Tivoli Monitoring, create a new or add an existing location to a given performance schedule.
Enter a target host name, where the ITM Monitoring Agent resides, from which to collect data from and select the IBM Tivoli Monitoring item from the list of available data sources (see Figure 3 in Part 1, Scheduling and reporting).
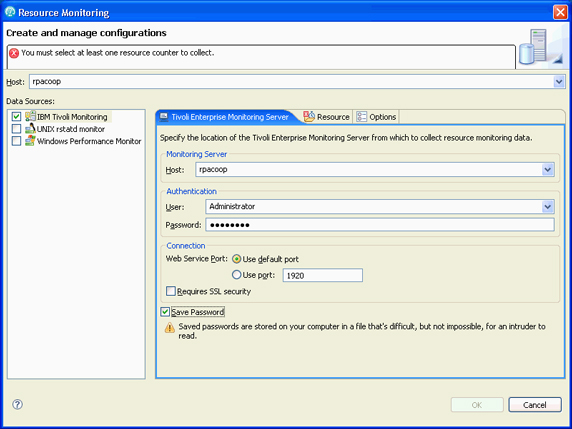
On the Tivoli Enterprise Monitoring Server tab, specify the monitoring server that you want to use to capture resource monitoring data as shownin Figure 4:
- Type the IP address or the fully qualified host name of the monitoring server in the Host field on the Tivoli Enterprise Monitoring Server tab. This is different from the Host field at the top of the Create and manage configurations wizard, which indicates the monitoring agent.
- Type the user name and password for the monitoring server in Authentication.
- Change the Connection information if needed. Typically, your Tivoli system administrator will specify this information.
- Select Save Password to save your password locally. If you do not save your password, you might be prompted for it (depending on the host system configuration) when editing the configured location or when running test schedules that use the location.
After you have specified the monitoring server, you can select resources to capture. If the host is not managed by the monitoring server, we will see an error message.
On the Resource tab, select the type of data that you want to capture, as shown in Figure 5. The tree view shows the host and all of its available IBM Tivoli Monitoring agents, and their respective counter groups and counters.

Clearing Show only selected counters allows us to see all available counters (Figure 6). Be selective; monitoring all possible resource data requires substantial amounts of memory. Hover over a counter with your mouse to see details about what that counter measures.

On the Options tab, the time interval properties can be configured (Figure 7):
- Enter the Polling Interval (in seconds), for collecting resource data. For example, if you accept the default of 5 seconds, counter information will be collected at 5-second intervals from the specified host during the schedule run.
- Enter the Timeout Interval (in seconds). If the resource monitoring host does not respond within this amount of time during a schedule run, an error is logged.

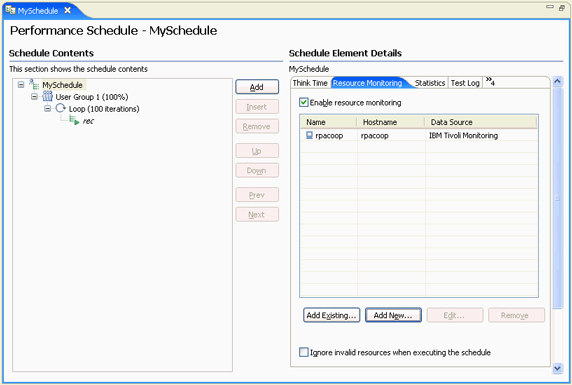
Once configuration is complete and saved, the resource monitoring location will be added to the performance schedule (Figure 8).
Profiling for real-time observation
Performance Tester has the ability to collect from ITM monitoring agents, in real-time, without having to configure a resource location through a performance schedule. This capability is valuable for large enterprise environments where different machines are used for performance testing and system monitoring. In addition, even though this resource data is collected outside of a performance schedule, you can overlay these counters using the Performance Test Runs view of an existing Performance Tester Report.
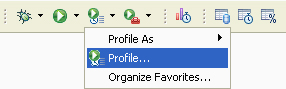
To initiate real-time data collection from an ITM monitoring agent, select Run > Profile or use the toolbar button to open the launch configuration dialog (Figure 9). This profile action will ask us to switch into the Profile and Logging perspective of the Performance Tester product. This perspective enables profiling tools and has a different layout of the views on the workbench.
Resource monitoring configuration using the performance schedule is similar to configuring real-time monitoring (Figure 10). One difference is that you can specify where the collected data should be stored using the Destination tab. Clicking Profile after the tab pages have been completed will initiate data collection.

As data is collected from the selected ITM Monitoring Agents, it is plotted on a graph display (Figure 11). As each new data point is observed and received by the client, the point will be plotted. The graph display is available by right-clicking on the agent in the Profiling Monitor view. Figure 11 illustrates the trend between the network traffic, disk activity, and processor activity.

Importing data from IBM Tivoli Monitoring
IBM Tivoli Monitoring is a managed solution that store all observed monitoring data in a data warehouse. This architecture allows us to query ITM for historical data from a particular agent, if needed.
In the workbench client, you can import the data using two methods:
- An import wizard that is accessible by selecting File > Import (Figure 12).
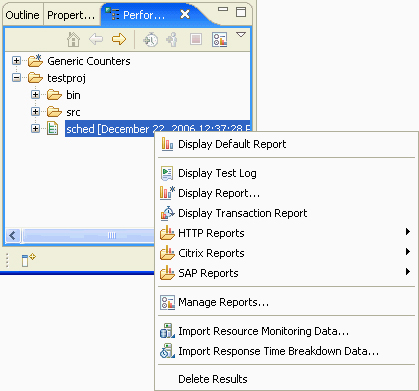
- An import wizard that is accessible by right-clicking on a performance report in the Performance Test Runs view (Figure 13) or on the resources report, which is the last tab in the view.

Once the wizard is loaded, specify a resource location configured using the ITM data source (Figure 14).

From the three data collectors offered in Performance Tester, only ITM is capable of collecting historical data. If you try to add a resource location configured for any other data source the collection for these locations will be ignored during import and the user will be alerted (Figure 15).

The next stage of the import wizard is to specify the time period from which to import data (Figure 16). This can be specified as either the start and end times or as the amount of time you specify, counted backward from the time that you click Finish. You might need to adjust the time interval to compensate for clock discrepancies between the workbench and the monitoring server.
Note: When specifying the time in a specific number of units, note that, for consistency, month is defined as 30 days and year is defined as 365 days. Days refers to 24-hour periods, not calendar days. The units of time selected are subtracted from the point in time when you click Finish to import the data to give the start time. For example, if you select 2 months, the time period will be the 60 days (24-hour time periods) immediately prior to the point in time that you click Finish.

To import data from ITM, the ITM monitoring agent itself must be configured for historical data collection. If the agent is not properly configured, an error message will be displayed to the user when attempting the import, as shown in Figure 17.

After the import process has completed, the data is displayed in one of two ways, depending on how the import wizard was invoked:
- If the user invoked the wizard from the File > Import menu, this action indicates that there is no association to a performance result and the data is displayed using the default statistical view in the Profile and Logging perspective (Figure 18).
- If the user invoked the wizard by right-clicking on a performance result, this action indicates the imported data is associated to the selected performance result. The data can be viewed using the Resource tab in the default report when the performance result is opened. Alternatively, if you manually switch to the Profile and Logging perspective, you can view and analyze the data using the default statistical view in the Profile and Logging perspective.

Resources
Learn
- See Part 1 of this article, Resource monitoring using IBM Rational Performance Tester: Part 1, Scheduling and reporting on developerWorks.
- Learn more about IBM Rational Performance Tester on developerWorks.
- Learn about IBM Rational software quality.
- Visit the Microsoft Developer Network (MSDN), Performance Monitoring page.
- Study the Eclipse Test and Performance Tools Platform documentation
- Read the IBM Tivoli Monitoring v6.1.0: Installation and Setup Guide (First Edition, November 2005), GC32-9407
- See "Administering OMEGAMON Products: CandleNet Portal," V195 July 2004, Candle Corporation
- RSTAT - RFC 1831, 1832, and 1833 (These are the RFCs consulted when implementing the RSTAT monitoring component.)
- Learn more about rstat on the HP-UX reference page.
- Browse the technology bookstore for books on these and other technical topics.
Get products and technologies
- Get a trial download of Rational Performance Tester.
- Here is the
IBM Performance Optimization Toolkit.
Discuss
- Participate in the discussion forum.
- Check out developerWorks blogs and get involved in the developerWorks community.