Read NeoLoad graphs
With the NeoLoad plugin, Jenkins can display:
- response times and error rates trend graphs in the selected job page and designed from XML reports generated by NeoLoad
- an SLA trend graph in the selected job page and designed from XML JUnit reports generated by NeoLoad
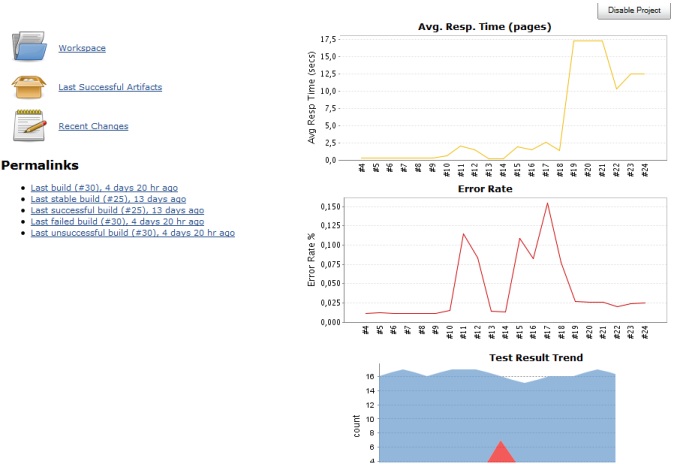
When a job is selected, Jenkins displays the job page with the NeoLoad graphs.

The Avg. Resp. Time (pages) graph compiles the values for the average response times of the tested application pages per build.
The Error Rate graph compiles the percentage values of hits in error on the whole test per build.
The Test Result Trend graph compiles the results of the SLA defined in NeoLoad per build. "Passed" results are displayed in blue. "Failed" results are shown in red. NeoLoad "Acceptable" results are considered either passed or failed with the -SLAJUnitMapping <pass> or -SLAJUnitMapping <fail> command line arguments respectively.
In the graphs, the X axis lists the builds started for the job. When a test fails, the curve is smoothed between two continuous successful tests.
- Warning: Trend graphs are available only when two successful jobs at least are available in Jenkins.
- To display the NeoLoad graphs in Jenkins
- In Jenkins, start a build of a job configured with the NeoLoad plugin.
- When the test is over, click <NeoLoad job>.