Read NeoLoad graphs
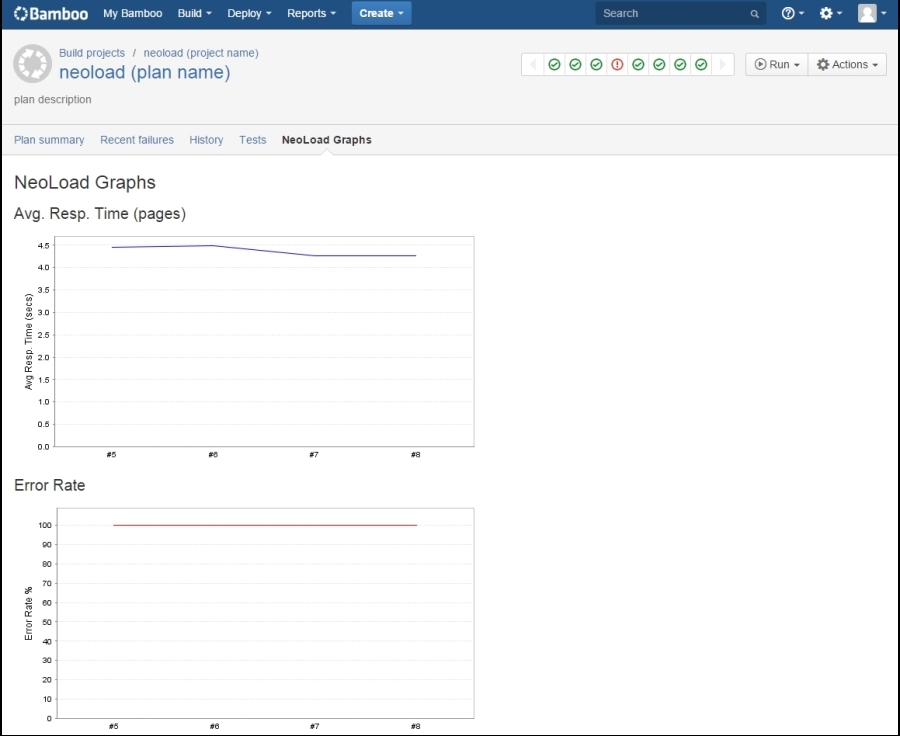
After running a NeoLoad plan, Bamboo can display:
- average response time trend graphs
- error rates trend graphs
- To display the NeoLoad graphs in Bamboo
- In Bamboo, run a plan configured with the NeoLoad plugin.
- When the test is over, select your NeoLoad plan name.
- Click the NeoLoad Graphs tab.

The Avg. Resp. Time (pages) graph compiles the values for the average response times of the tested application pages per build.
The Error Rate graph compiles the percentage values of errors on the whole test per build.
-The X axis lists the runs of the plan.
- Trend graphs are available only when at least two runs are available.