WebSphere Lombardi Edition 7.2 > Create reports
Use out of the box scoreboards
Lombardi includes several standard, out of the box scoreboards in the Process Portal that are designed to help you manage your business processes. The following sections provide more information about each scoreboard, including any configuration requirements to enable process participants to access these scoreboards from Lombardi Process Portal.
My Performance
The My Performance scoreboard shows the current status of your
Lombardi tasks for either a specific Lombardi group, or all the groups of which
you are a member. You can also choose a specific business process to analyze or
view data for all the processes in which you participate. The report details
include:
- A pie chart that shows the percentage of tasks on target, at risk, or overdue.
- A bar chart that shows when upcoming tasks will become overdue.
- A task list that shows the status for each of your assigned tasks.
- A bar chart that compares your individual performance to the team/group average.
- A bar chart that shows the trend of your performance (completed versus active tasks).
The following image shows the My Performance scoreboard in Lombardi Process Portal:

You must have assigned Lombardi tasks due to in-flight or completed process instances in order to see report details in the My Performance scoreboard.
By default, this scoreboard can be accessed in Lombardi Process Portal by members of the All Users participant group. A Lombardi administrator can change the members of the All Users participant group to ensure that all users who need access in each configured Lombardi environment are given access. An administrator can start the Process Admin Console for the appropriate server (Process Server in runtime environment or Process Center Server in development environment), go to the Installed Apps area of the Process Admin Console, select the current snapshot of the Process Portal process application, select the Role Bindings option, and then adjust members.
The current snapshot of the Process Portal process application is named to match the release of Lombardi with which it was shipped. For example, the snapshot for Lombardi 7.0.0 release has a label of 7.0.0.
My Team Performance
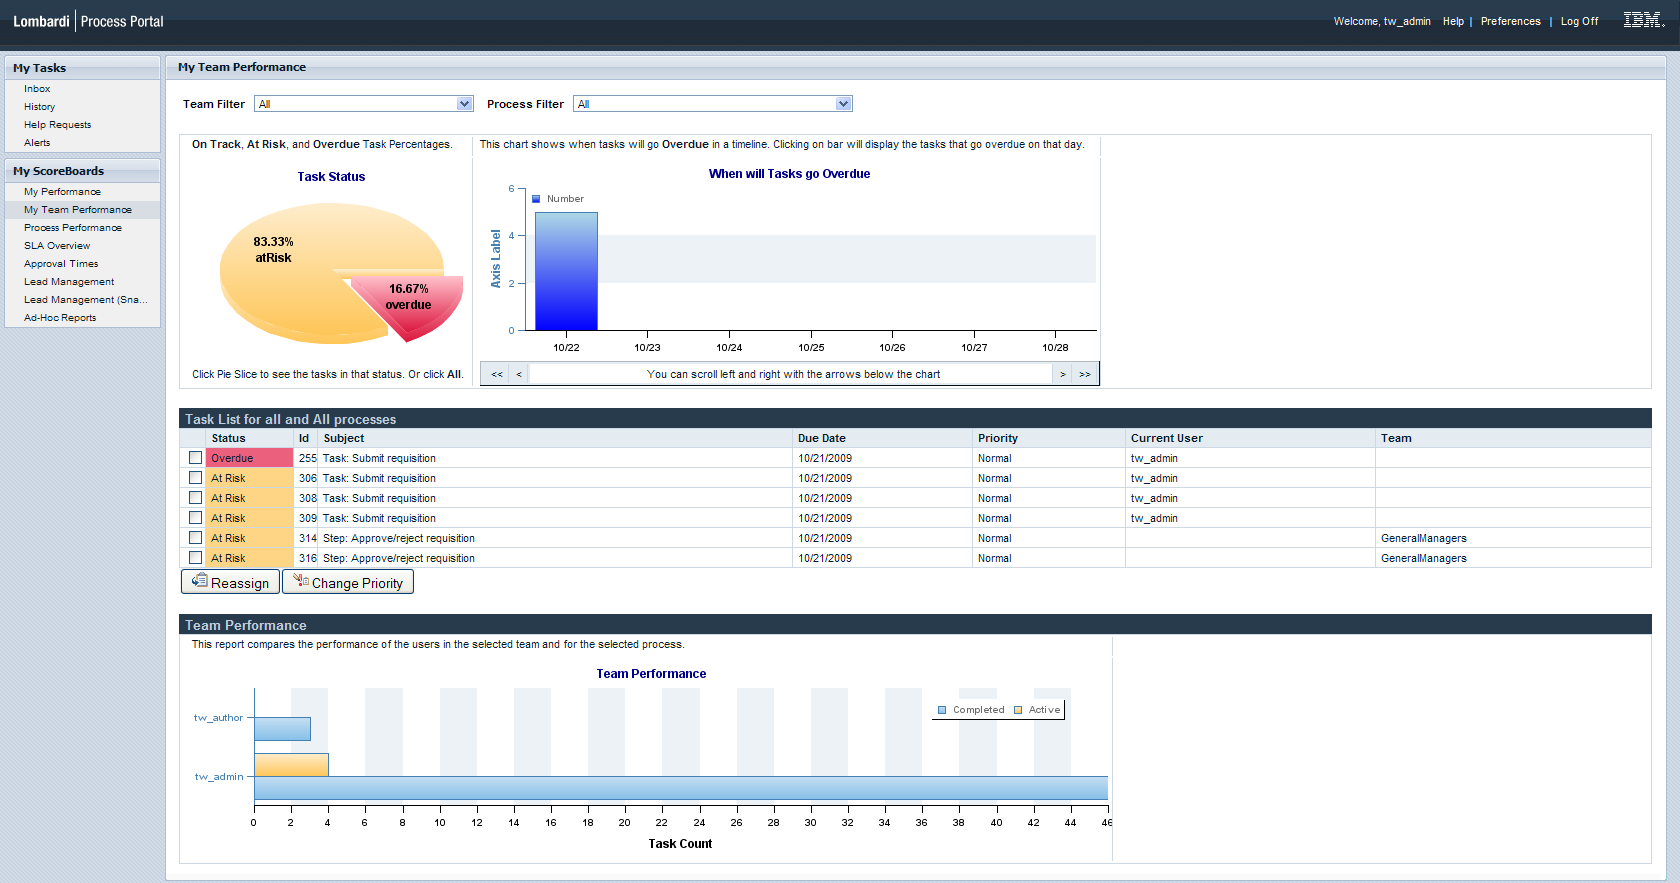
The My Team Performance scoreboard shows the current status of the Lombardi tasks for Lombardi groups for which you are designated as a team manager. You can also choose a specific business process to analyze or view data for all the processes in which the currently selected team participates. The report details include:
- A pie chart that shows the percentage of tasks on target, at risk, or overdue.
- A bar chart that shows when upcoming tasks will become overdue.
- A task list that shows the status for each of the team's assigned tasks. The task list helps you understand the status of currently running processes and whether reallocating tasks to balance workloads is necessary.
- A bar chart that compares the performance of individual team members. The chart shows both current and completed tasks for each individual participating in the selected process(es). Use this chart to determine the best work allocations.
The following example describes how a manager can use the My Team Performance scoreboard to understand and balance workloads for team members:
Evan reports to Carl in IT and he also participates in an HR process that Sarah manages. Evan has five active tasks in the HR process and one active task in the IT process. Evan has previously completed two tasks in the HR process, but has not yet completed any tasks in the IT process.
In the My Performance scoreboard, Carl selects IT team from the Team Filter list and All from Process Filter and sees:
- One task in the Task List. Evan has only one active task as member of the selected IT team.
- Eight tasks in the Team Performance bar chart. This represents Evan's total current workload (six tasks), plus the tasks that Evan has already completed (two tasks), across all of the processes that Evan participates in (HR and IT).
Now, Carl selects the IT process from the Process Filter and sees:
- One task in the Task List. Evan has only one active task in the selected IT process.
- No data in the Team Performance bar chart. Evan has not yet completed any tasks in the IT process.
So, Carl sees that Evan is a shared resource with the bulk of his current workload in the HR process. Carl can now better determine if it makes sense to assign more work to Evan, given Evan’s total current workload and past performance.
The following image shows the My Team Performance scoreboard in Lombardi Process Portal:
Process participants must have tasks assigned to them due to in-flight or completed process instances in order for team managers to see report details in the My Team Performance scoreboard.
Lombardi administrators can use the Process Admin Console to designate one security group as the team manager for another group. See Manage group membership in the Lombardi Administration Guide or Process Admin Console online help for step-by-step instructions. When you log in to Lombardi Process Portal as a member of a team manager group, you see task information for the members of the group that you manage.
By default, this scoreboard can be accessed in Lombardi Process Portal by members of the Managers participant group. A Lombardi administrator can change the members of the Managers participant group to ensure that all users who need access in each configured Lombardi environment are given access. An administrator can start the Process Admin Console for the appropriate server (Process Server in runtime environment or Process Center Server in development environment), go to the Installed Apps area of the Process Admin Console, select the current snapshot of the Process Portal process application, select the Role Bindings option, and then adjust members
The current snapshot of the Process Portal process application is named to match the release of Lombardi with which it was shipped. For example, the snapshot for Lombardi 7.0.0 release has a label of 7.0.0.
Process Performance
The Process Performance scoreboard shows the current status of the active instances of particular processes in your organization. The specific processes that are included in the Process Performance scoreboard can be configured as explained in the following procedure. For each process, the performance data in the scoreboard includes:
- A pie chart that shows the percentage of tasks on target, at risk, or overdue for the currently active instances of the process.
- A trend chart of the number of active instances of the process over the last week.
The following image shows the Process Performance scoreboard in Lombardi Process Portal:

You can control which processes are included in the Process Performance scoreboard from the Designer in Lombardi Authoring Environment. Open each process (BPD) that you want to include and enable the Expose performance metrics setting in the Overview tab. For step-by-step instructions, see Exposing BPDs.
The Business Process Definitions (BPDs) that you choose to include must have autotracking enabled and you must send tracking definitions to the Performance Data Warehouse. If not, performance data will not be displayed in the Process Performance scoreboard. To learn more about autotracking, see Tracking Lombardi performance data.
By default, this scoreboard can be accessed in Lombardi Process Portal by members of the Process Owner participant group. A Lombardi administrator can change the members of the Process Owner participant group to ensure that all users who need access in each configured Lombardi environment are given access. An administrator can start the Process Admin Console for the appropriate server (Process Server in runtime environment or Process Center Server in development environment), go to the Installed Apps area of the Process Admin Console, select the current snapshot of the Process Portal process application, select the Role Bindings option, and then adjust members Configure runtime participant groups.
The current snapshot of the Process Portal process application is named to match the release of Lombardi with which it was shipped. For example, the snapshot for Lombardi 7.0.0 release has a label of 7.0.0.
SLA Overview
If SLAs have been defined, the SLA Overview scoreboard displays a table that lists the name, description, and current status of particular SLAs. The specific SLAs that are included in the SLA Overview scoreboard can be configured as explained in the following procedure. You can click any of the SLAs listed in the table or the All SLAs entry to display a trend chart of violations for the chosen SLA.
The following image shows the SLA Overview scoreboard in Lombardi Process Portal:

You can control which SLAs are included in the SLA Overview scoreboard from the Designer in Lombardi Authoring Environment. Open each SLA that you want to include and enable the Expose setting.
By default, this scoreboard can be accessed in Lombardi Process Portal by members of the Process Owner participant group. A Lombardi administrator can change the members of the Process Owner participant group to ensure that all users who need access in each configured Lombardi environment are given access. An administrator can start the Process Admin Console for the appropriate server (Process Server in runtime environment or Process Center Server in development environment), go to the Installed Apps area of the Process Admin Console, select the current snapshot of the Process Portal process application, select the Role Bindings option, and then adjust members
The current snapshot of the Process Portal process application is named to match the release of Lombardi with which it was shipped. For example, the snapshot for Lombardi 7.0.0 release has a label of 7.0.0.
Parent topic: Create reports