WebSphere Lombardi Edition 7.2 > Simulating and optimizing processes
Sample historical analyses and comparisons
Run an historical analysis
When you're running instances of your processes and those processes have been configured to track data, you can run historical analyses in Lombardi Optimizer to determine how well those processes are performing. With simulations, you provide values that enable the Optimizer to estimate execution times and potential delays for activities. With historical analyses, you are able to analyze your processes based on the historical data that Lombardi tracks and stores in the Performance Data Warehouse.
The following image shows the diagram of the sample process that we'll be analyzing:

The flow of the sample process is as follows:
- The process begins by a Planner creating a Request for Quote (RFQ).
- A quote solicitation is sent out to a number of vendors.
- Each vendor responds with a proposed quote.
- The proposals are delivered to the Planner, who reviews them and selects one for approval.
- The selected proposal is
sent for Manager approval.
If approved, the Inventory system is updated and the order is placed.
If rejected, the Planner is asked to choose an alternative proposal. This loop is repeated until a proposal is approved.
In the following example, you'll analyze historical data for this
process to determine if any activities are bottlenecked. For this analysis, we
need to configure one Historical Analysis Scenario as outlined in the following
steps:
- In the Designer in Lombardi Authoring Environment, click the plus sign next to Processes and select Historical Analysis Scenario from the list of components.
- Name the scenario Vendor Mgmt and click Finish.
- For the Include Process Instances option, select All. We want to analyze data for both completed and currently executing (in flight) process instances.
- From the Time Range drop-down list, select All Available. We want to analyze all data stored in the Performance Data Warehouse, instead of data from a particular timeframe such as last month or last quarter.
- Under Process Apps to Include in Analysis, click the Add button and then select the process application that contains the process.
- Under Processes to Include in Analysis, click the Add button and then select the process that you want to analyze.
- Click Save in the main toolbar to save the scenario.
To run the analysis, follow these steps:
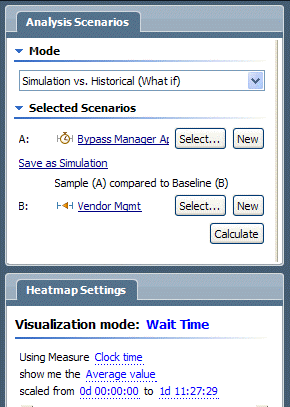
- Run the Optimizer with the Analysis Scenarios view settings shown in the following image:
- In the Heatmap Settings view, set the Visualization Mode to Wait Time and choose to show the Average value.
- Click the
Calculate button in the Analysis Scenarios
view.
The heat map shows analysis results like the following:
You can see that the wait time for the Manger Approval activity is over 1 day and 11 hours. This means that, on average, 1 day and 11 hours are elapsing between the time that a Manager Approval task is received by managers and they are able to open and start the task. Considering that this analysis is based on actual data from this process running in your environment, this wait time is an average you'd want to improve. The Guided Optimization Wizard can help, as outlined in the following section.


After running a historical analysis as shown in the preceding example, you can save the Historical Analysis Scenario as a simulation. When the Optimizer finishes running a historical analysis, a Save as Simulation option appears in the Analysis Scenarios view. Click the option and then provide a name for the scenario in the New Simulation Analysis Scenario dialog. The Optimizer opens the Simulation Analysis Scenario so you can make any desired changes and save it for future use.
Use the guided optimization wizard
Lombardi provides guided optimization from the Recommendations view in the Lombardi Optimizer. The wizard helps you analyze your processes to determine if there are correlations between business data values and potential process outcomes. For example, the wizard may help you discover that you approve all claims under a particular amount for a particular vendor. In such cases, you could improve your process by automatically approving those claims and bypassing the manual review. The following procedure demonstrates how to use guided optimization to continue the process analysis that we started in the preceding section.
Guided optimization is available only when you perform historical
analyses in Lombardi Optimizer.
- From the Recommendations view, scroll down to the recommendation named Investigate bypassing 'Manager Approval' and click Launch Bypass Wizard.
- In the Variable Analysis - Settings dialog, select the Variable to Predict from the drop-down list. You should choose a variable that the activity changes. For example, in the following image, we've selected the status variable because the Manager Approval activity sets the value of this variable to either approve or reject. You want to choose a variable for which a certain set of business data might always create the same result. If so, you could just bypass the work done in the activity and automatically set the predicted value.
- From the Variables to Consider section of the Variable Analysis - Settings dialog, clear selections for any variables that you do not want to be considered in the predictive analysis. You want to pick all the variables that you think may significantly affect the outcome of the activity. For example, in the following image, we've selected all variables since each could impact the outcome for this activity.
- For this example, accept
the default selections for the Confidence and Complexity levels.
The Confidence setting tells the Optimizer to only suggest bypasses that are correct the shown percentage of time. The Complexity setting determines how complex the suggested bypass designs might be.
- Click
Next.
The Optimizer runs its calculations to find the correlations between the selected variable and the historical data. The analysis results for this example show that the analyzed activity resulted in an approved quote 100% of the time when the vendor was 'BJR Supplies' and the prices was less than '11, 307':
- Select the Continue and Bypass Activity option and then click Next.
- In the Bypass Activity
Rules dialog, the wizard displays the rules that it recommends:
Click the checkbox next to the rule to automatically accept quotes that are from BJR Supplies and are less than 11, 307. Only when the price matches or exceeds this price, will Manager approval be required for quotes from BJR Supplies.
- In the Bypass Activity
Rules dialog, choose between creating a Rule Service or a Script for your
process.
An embedded Script causes fewer visible changes to your process, but a Rule Service enables you to tell, just from looking at your diagram, where a rule is used in a process. A Rule Service is also a reusable library item, unlike an embedded Script. In this example, we'll create a Rule Service.
- In the Bypass Activity
Rules dialog, select the
Pre-Configure What-If Analysis checkbox.
The wizard automatically creates a new simulation scenario that incorporates the previously selected rules and then performs a what-if analysis by comparing the simulation of the rules to the historical data for the process.
The Pre-configure What-If Analysis option, when selected, makes the appropriate selections in the Analysis Scenarios view, but the analysis does not run until you click the Calculate button in the Analysis Scenarios view.
For simulation scenarios created by the Guided Optimization Wizard, the results are more meaningful if the process being analyzed is executed often (high frequency) and is initiated on a regular schedule (flat distribution).
- Click
Finish.
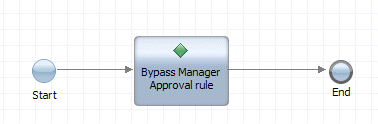
The Optimizer creates the required components for the Bypass Rule Service and adds them into your process diagram, complete with sequence lines and appropriate component properties (the new components are selected in the following image to highlight them):


To review the changes introduced by the bypass wizard:
- From the Designer, double-click the Manager Approval bypass rule service activity to view the attached Rule Service:
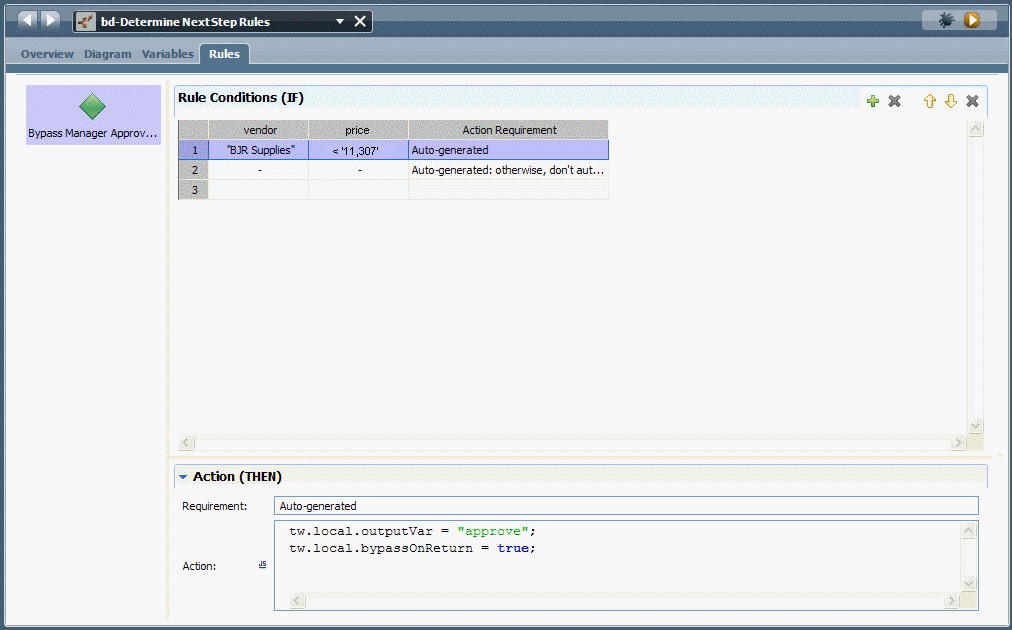
- Double-click the Bypass Manager Approval Rule Service to view its structure:
- Select a rule condition from the table and then click the Action section to view the auto-generated action that each rule runs when it evaluates to true at run time.
Run a Simulation vs. Historical comparison
To run the Simulation vs. Historical (What if) analysis that was
automatically generated by the wizard in the preceding sample, follow these
steps:
- Go to the Analysis
Scenarios view in the Optimizer to see the settings established by the wizard:
You can see that the simulation data for the revised process (with the built-in service to bypass the approval step) will be compared to the Historical Analysis Scenario that originally revealed the Wait Time issue.
- Click the
Calculate button in the Analysis Scenarios
view.
The heat map now shows that the Approval Activity is no longer bottlenecked:

You can run similar what-if comparisons by:
- Create different versions of your process with additional services or other workarounds.
- Create a simulation profile for each version of the process.
- Create a Simulation Analysis Scenario in which you can pick and choose from the profiles created in the preceding step.
- Run a Simulation vs. Historical (What if) comparison using a default Historical Analysis Scenario (like All Available) for the baseline and the Simulation Analysis Scenario from the preceding step as the sample.
Parent topic: Simulating and optimizing processes