WebSphere Lombardi Edition 7.2 > Use Process Portal > Work with reports
Create ad-hoc reports in Process Portal
With Lombardi Process Portal you can create customized reports using
business variable data from your processes. Using the Ad-Hoc Report option, you
can:
- Create and share ad-hoc reports from the Process Portal, without having to first create a report in the Designer in Lombardi Authoring Environment.
- Generate dynamic reports in multiple display formats (pie charts, bar charts, and so on).
- Bind business variable data to chart elements to customize your report displays.
- Export report data to a Microsoft Excel file.
To create a report using the Ad-Hoc Report option in Lombardi Process
Portal:
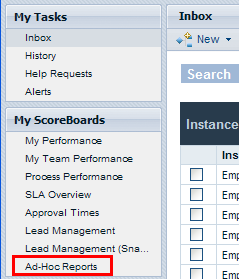
- Click the
Ad-Hoc Reports link under
My ScoreBoards as shown in the following figure.
-
In the Ad-Hoc Reports page, click the New Ad-Hoc Report button, as shown in the following image.
The New Ad-Hoc Report button is available only if you are a member of one or more participant groups to whom a BPD is exposed (Expose business data setting).

-
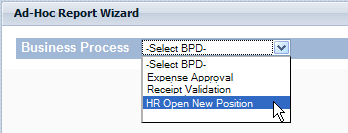
From the drop-down list at the top of the page, select the name of the business process definition (BPD) from which to pull data for the report, as shown in the following figure.
- Choose a
Chart Layout (for example, bar chart, pie chart,
etc.) from the drop-down list under
Chart Preview.

-
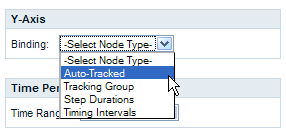
To specify which variables will be displayed in a report chart, you must bind variables to the selected chart.
To bind a variable to an axis, for example, simply select the variable name from the drop-down list, as shown in the following figure. When you select a Binding type (for example, Auto-Tracked, Tracking Group, Step Durations, Timing Intervals, etc.), a second drop-down list appears displaying the variables that are associated with the binding type you selected, as shown in the following figure.
Only those variables for which Tracking is enabled in the BPD are displayed in the drop-down lists. For example, if you choose Auto-Tracked for the Binding and no variables are being tracked in Lombardi Authoring Environment, the Process Portal displays No tracked items in the drop-down list. And, some bindings do not appear as options in the Process Portal until they are configured for the selected BPD in Lombardi Authoring Environment and tracked performance data is captured in the Performance Data Warehouse. See the Reporting section in Lombardi Authoring Environment User Guide or online help for more information about tracking data and configuring reports.
- Select the variables to bind
to the X-axis and Y-axis of a bar chart, .

- Click the Refresh Chart button to view the data in the chart preview.
Saving an ad-hoc report in Process Portal
Saving an ad-hoc report in Lombardi Process Portal enables you and other users to view the report at any time.
When you save an ad-hoc report in Lombardi Process Portal, you cannot modify the saved report. Be sure that your report is configured properly before you save it, because you cannot edit the report settings in the Process Portal after saving the report.
- Click the
Save As Lombardi Report button, as shown in
the following figure.

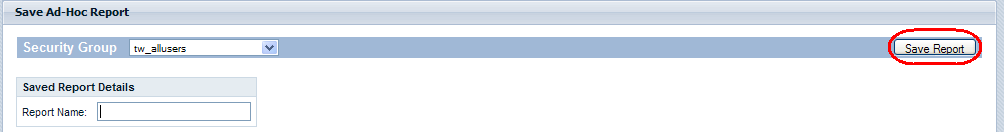
- Select the Lombardi
security group whose members should be able to view the saved report, type a
name for the report in the
Saved Report Details field, and then click the
Save Report button, as shown in the following
figure.
-
You can view saved reports by clicking Ad-Hoc Reports under My Scoreboards and then selecting the report name from the Saved Ad-Hoc Reports drop-down list as shown in the following image.
You can also remove the report by clicking the Delete Report button.

Advanced ad-hoc report filtering
When choosing which business variables will be displayed in an ad-hoc report chart, you can customize the following filters to refine the report data:
Sorting on X-axis
For some business variables you can select a Sorting option (for example, Ascending Order or Descending Order) from the drop-down list to determine how data is displayed along the X-axis, as shown in the following figure.

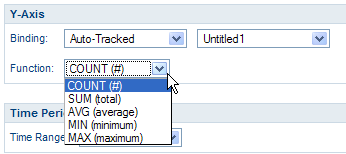
Functions on Y-axis
For some business variables you can select a
Function option from the drop-down list to
determine how data is displayed along the Y-axis, as shown in the following
figure:
- COUNT: Returns the number of occurrences for the bound variable.
- SUM: Returns the total number of all occurrences for the bound variable.
- AVG: Returns the average of all occurrences for the bound variable.
- MIN: Returns the minimum of all occurrences for the bound variable.
- MAX: Returns the maximum of all occurrences for the bound variable.
For Step Durations and Timing Intervals you can optionally convert from milliseconds to seconds, minutes, hours, or days.
Time Period Filter
From the Time Range drop-down list, select a relevant time period (for example, Last Year, Current Year, Last Quarter, Current Quarter, etc.) for displaying data in the report chart, as shown in the following figure. You can also use a custom time period with a specific start date and end date. Selecting Custom Period from the Time-Range drop-down list enables the Start Date and End Date fields, which are hidden by default. You can either type the start and end dates into the fields directly or click on the calendar icons to select the dates.

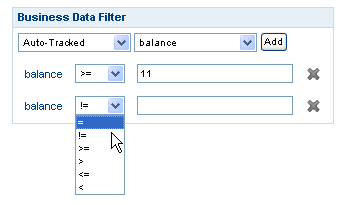
Business Data Filter
The Business Data Filter enables you to filter the data for a selected business variable even further by supplying a conditional statement (for example, Equals, Greater Than, Greater Than or Equal To, Less Than, Less Than or Equal To, etc.) related to some specified value, as shown in the following figure. Click the Add button to build conditional statements for the report.
Export an ad-hoc report to an Excel file
To export the data from an ad-hoc report in Lombardi Process Portal to
a Microsoft Excel (.xls) file:
- Click the
Export to Excel button, as shown in the following figure.

- Choose whether to open or
save the Excel file, as shown in the following figure.

Parent topic: Work with reports