Administration guide > Monitor the environment
|
| |
|
|
Statistics overview
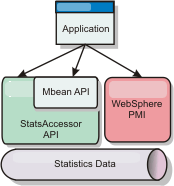
Statistics in WebSphere eXtreme Scale are built on an internal statistics tree. The StatsAccessor API, Performance Monitoring Infrastructure (PMI) modules, and MBean API are built from the internal tree.
The following figure shows the general setup of statistics for WebSphere eXtreme Scale.
Figure 1. Statistics overview
 Each of these APIs offer a view into the statistics tree, but are used for different reasons:
- Statistics API: The Statistics API allows developers direct access to statistics for flexible and customizable statistics integration solutions, such as custom MBeans or logging.
- MBean API: The MBean API is a specification-based mechanism for monitoring. The MBean API uses the Statistics API and runs local to the server Java™ Virtual Machine (JVM). The API and MBean structures are designed to readily integrate with other vendor utilities. Use the MBean API when you are running a distributed object grid.
- WAS Performance Monitoring Infrastructure (PMI) modules: Use PMI if you are running WebSphere eXtreme Scale within WAS. These modules provide a view of the internal statistics tree.
Statistics API
Much like a tree map, there is a corresponding path and key used to retrieve a specific module, or in this case granularity or aggregation level. For example, assume there is always an arbitrary root node in the tree and that statistics are being gathered for a map named "payroll," belonging to an ObjectGrid named "accounting." For example, to access the module for a map's aggregation level or granularity, you could pass in a String[] of the paths. In this case that would equate to String[] {root, "accounting", "payroll"}, as each String would represent the node's path. The advantage of this structure is that a user can specify the array to any node in the path and get the aggregation level for that node. So passing in String[] {root, "accounting"} would give you map statistics, but for the entire grid of "accounting." This leaves the user with both the ability to specify types of statistics to monitor, and at whatever level of aggregation is required for the application.
WAS PMI modules
WebSphere eXtreme Scale includes statistics modules for use with the WAS PMI. When a WAS profile is augmented with WebSphere eXtreme Scale, the augment scripts automatically integrate the WebSphere eXtreme Scale modules into the WAS configuration files. With PMI, you can enable and disable statistics modules, automatically aggregate statistics at various granularity, and even graph the data using the built-in Tivoli Performance Viewer. See Monitor with WAS PMI for more information.
Vendor product integration with Managed Beans (MBean)
The eXtreme Scale APIs and Managed Beans are designed to allow for easy integration with third party monitoring applications. JConsole or MC4J are some examples of lightweight Java Management Extensions (JMX) consoles that can be used to analyze information about an eXtreme Scale topology. You can also use the programmatic APIs to write adapter implementations to snapshot or track eXtreme Scale performance. WebSphere eXtreme Scale includes a sample monitoring application that allows out-of-the box monitoring capabilities, and can be used as a template for writing more advanced custom monitoring utilities.Figure 2. MBean overview

See Monitor with the xsAdmin sample utility for more information. For more information about integrating with specific vendor applications, see the following topics:
- Monitor eXtreme Scale with IBM Tivoli Monitoring agent
- Monitor eXtreme Scale with Hyperic HQ
- Monitor eXtreme Scale applications with CA Wily Introscope
Parent topic:
Monitor the deployment environment
Related concepts
Related tasks
Monitor with the statistics API
Monitor with the xsAdmin sample utility
Monitor with managed beans (MBeans)
Monitor eXtreme Scale information in DB2
Access Managed Beans (MBeans) using the wsadmin tool
Access Managed Beans (MBeans) programmatically
Related reference
Administer programmatically with Managed Beans (MBeans)
Related information
API documentation: Package com.ibm.websphere.objectgrid.management