Logging services
Use the WAS recommendations for logging and tracing.
Since logging from WebSphere Commerce makes use of the logging facility from WAS, the Log Analyzer can be used. The Log Analyzer is a graphical utility that facilitates viewing and analyzing log files.
For information about recording commands and tasks that are executed during a WebSphere Commerce operation, refer to business auditing.
The WebSphere Commerce Log APIs are:
| ECTrace | Traces the data flow. The trace entries are captured in a file for debugging purposes. Tracing is used for problem determination. Tracing assists developers in debugging code during the development stage and assists the technical support team in solving customer problems.
Tracing data is persisted for future reference in a trace file. A data structure consists of context information, such as a class name, a method name, and a text message. Multiple data structures describe the data flow within a software application. By analyzing the data structure sequence, a developer can understand the path that was executed, which can help determine the cause of malfunctions. |
| ECMessage | Logs diagnostic messages. Messages are locale-sensitive, and are stored in log files in the file system. If error notification is enabled, technical support receives alert notifications. Diagnostic logs are used for problem determination. By default, the log file name is SystemOut.log. |
Diagnostic logs are used for problem determination. ECMessageLog logs diagnostic messages, and ECMessages are localized. ECMessages are divided into the following categories:
| System messages | System messages display in the logs and are for recording problems or potential problems (that is, warnings). System messages provide diagnostic information for Site Administrators. These messages may follow a system malfunction, or indicate some other significant event.
System messages are assigned a product-specific message ID. Site Administrators can use the message ID to look up more details associated with that message; customers can report the message to support personnel for troubleshooting. Messages from previous versions of WebSphere Commerce use the CMN nnnns format, and messages new for WebSphere Commerce 5.6 use the format CWX ccnnnns. In both cases, be familiar with the following:
| ||||||||||||
| User messages | Are frequently shown on the browser, and are for the benefit of a customer visiting the site. User messages will give details about the problem. For example they will indicate whether a parameter specified is invalid, which indicates to the customer what value to fix when they resubmit the request. | ||||||||||||
| JRas | Consists of multiple java packages that form a standalone logging toolkit
that provides message logging and diagnostic trace primitives. These primitives
are not tied to any particular product or platform. JRas is composed of several
components:
|
For more information about the JRas logging toolkit, see the Understanding the JRas facility topic in the WAS Information Center.
Logging file location
The location of the default output files is:
- AIX|Linux|Solaris|Windows:
WAS_installdir/profile/WC_profile/logs/server1
- I5/OS:
WAS_userdir/logs/server1
The default output files are:
| native_stderr.log | A process log that contains text written to the stderr stream. |
| native_stdout.log | A process log that contains text written to the stdout stream. |
| startServer.log | A log written when starting the server. |
| stopServer.log | A log written when stopping the server. |
| SystemErr.log | Logs any system error while the server is running. |
| SystemOut.log | Logs the system output file while the server is running. |
| activity.log | Logs continuous activity. This log is located in the WAS_installdir/logs directory. |
| trace.log | If trace is enabled, logs the components trace messages while the service is running. |
Logging levels
There are three logging levels, or severities, in the WebSphere Commerce logging system. The system message severities are:
- error
- warning
- informational
Although the WAS logging facility also uses the status and debug logging levels, WebSphere Commerce utilizes and maps to the error, warning, and informational logging levels.
| Error messages | Are logged at all times by default. Error messages expose an error condition that can lead to system malfunction. An error message can be sent as an e-mail, WebSphere MQ message, or by another form of notification to a Site Administrator registered with messaging. |
| Warning messages | Reveal a potential problem. |
| Information messages | Follow events that occur within the WebSphere Commerce system. Information messages are related to events that trigger changes in the system state. For example, an information message is persisted when an order has been submitted. |
Since WebSphere Commerce uses the WebSphere Application Server logging facility, refer to the following table to learn about how the WebSphere Commerce logging levels are mapped to the WebSphere Application Server as follows:
| Logging levels in WebSphere Commerce | Logging levels in WAS |
|---|---|
| DEBUG | TYPE_INFORMATION/TYPE_INFO |
| ERROR/ERR | TYPE_ERROR/TYPE_ERR |
| INFORMATION/INFO | TYPE_INFORMATION/TYPE_INFO |
| STATUS | TYPE_INFORMATION/TYPE_INFO |
| WARNING/WARN | TYPE_WARNING/TYPE_WARN |
The WebSphere Application user interface is used to control the enablement of the logging level or severity type. Site Administrators can specify which logging severities to record in the WAS Administration Console.
View log files
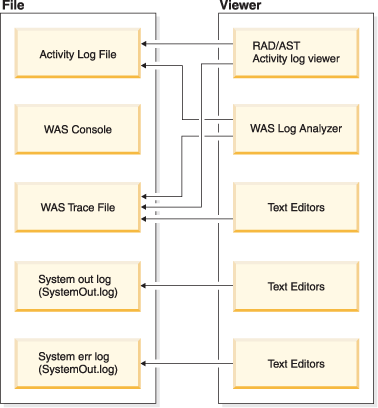
You can view log files in various ways. Typically, depending on the type of log file, there are suggested methods to view as follows:
- Use the Rational Application Developer (RAD) or AST activity log viewer to view activity log files and WAS trace files.
- Use the WAS log analyzer to view activity log files and WAS trace files.
- Use any text editor to view WAS trace files, system out log files, or system error log files.
The following diagram illustrates these suggested view methods:

Related Concepts
Business auditingLogging and messages
Configure logging