Data you can collect with request metrics
Typically, different components of the enterprise application might be hosted across several nodes in a distributed system. For example, the servlets might be hosted on one node, while the enterprise beans on which these servlets depend might be hosted on an entirely different node. When a request comes to a process, the process might send the request to one or more downstream processes, as shown in the following figure:
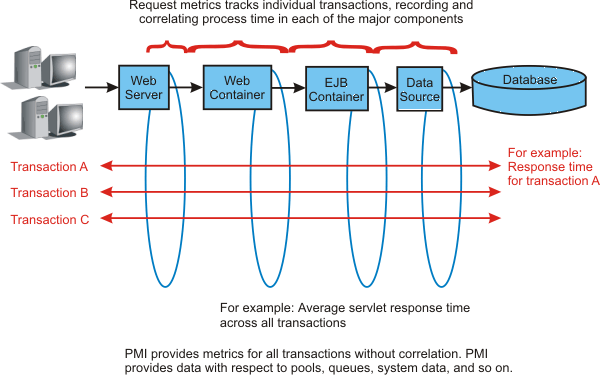
Trace records might be generated for each process with associated elapsed times for that process. These trace records might be correlated together to build a complete picture of the request flow through the distributed system, similar to the diagram in Why use request metrics?.
You can view the process response time that is monitored by request metrics through the Application Response Measurement (ARM) interface and system log files. When a request is sent to the appserver, request metrics captures response times for the initiating request and any related downstream invocations. Request metrics are instrumented in the following components as the request, for example, transaction, travels through the Web server, Proxy Server and the appserver:
- Web server plug-in
- Proxy Server
- Web container, including servlet and servlet filters
- EJB container
- JDBC calls
- JCA
- Web services, both on the server and the client side
- JMS engine
- Service Integration Bus
- Portlet container, including the portlet requests
- Asynchronous Beans
Select which components to instrument. For example, if you want instrumentation data only for the Web container and the JMS API, select this data in the console and the detailed instrumentation data is generated only for the components that you select. The edge transactions are traced for the other components that are not specified for instrumentation.
When filtering is enabled, only requests that match the filter generate request metrics data, create log records, or call the ARM interfaces. You can add work into a running system specifically to generate trace information to evaluate the performance of specific types of requests in the context of normal load, ignoring requests from other sources that might affect the system. If the request matches any filter with a trace level greater than None, trace records are generated for that request.
Related tasks
Monitor application flowWhy use request metrics?
Getting performance data from request metrics