WebSphere XD Health Management
- Overview
- Health policies
- Policy types
- Reactions
- Reaction modes
- Guided activities
- The health controller
- Configuring the health controller using scripting
- Locating the health controller
- Define health policies
- Age-based condition
- Excessive request timeout condition
- Excessive response time condition
- Memory condition: excessive memory usage
- Memory condition: memory leak
- Storm drain condition
- Workload condition
- Default health policies
- Managing health policies with scripting
- Monitoring runtime tasks
- Health monitoring tips
- References
Overview
Health management is an autonomic feature within the dynamic operations scope of WebSphere Extended Deployment (ND). Health management is the ability of the system to take a policy-driven approach to monitoring the application server environment and taking action when certain criteria are discovered.
WebSphere XD provides a health monitoring and management subsystem. This subsystem continuously monitors the operation of servers to detect functional degradation that is related to user application malfunctions. The health management subsystem consists of two main elements: the health controller and health policies.
Health policies
When we define a health policy, we first choose which kind of health policy we want, then we set the parameters for the condition and which action should be taken in the event of a policy breach. The last step is to specify the members which should be monitored by this policy. We can assign policies to members on cell, dynamic cluster, static cluster or application server/node level.
To define a health policy select...
Operational Policies | Health Policies | New...from the Administrative Console. Health policies can also be defined and maintained using scripting
Policy types
A health policy defines a set of conditions that are interpreted by WebSphere XD as a degradation of server function. There are seven different types of health conditions in IBM WebSphere XD V6.0.
These policy conditions are based on the following conditions:
- Excessive memory consumption can indicate a memory leak. There are two different memory related conditions: excessive memory and memory leak.
- Excessive response time can indicate a hung server.
- Excessive request timeout can indicate a hung server.
- Storm drain detection relies on change point detection on a given time series data.
- The volume of work the server performs.
- The age of the server.
Reactions
Depending on the policy type, there are different actions that will be performed if a policy breach is detected. Possible reactions are:
- Restarting the application server.
This reaction is available for all policy types.
- Taking a thread dump.
This reaction is only available for the Excessive request timeout condition. The option to take thread dumps is only supported for application servers running in IBM JVMs.
- Taking JVM heap dumps on IBM Java Development Kit (JDK).
This reaction is only available for the Memory condition: memory leak policy type. This option also works for IBM JVMs only.
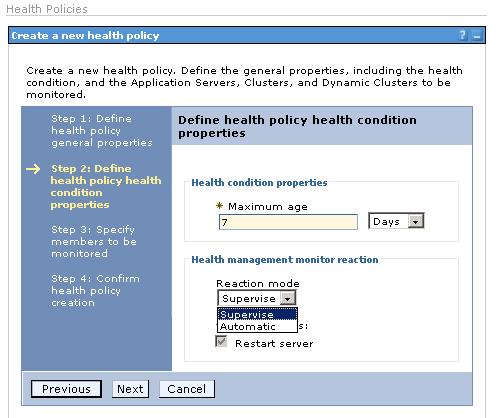
Reaction modes
After selecting the policy type and the action that should be performed in the event of a policy breach, we must specify the reaction mode. The reaction mode defines the level of user-interaction when the health condition determines corrective action is needed. There are two possible reaction modes:
- Supervised
The supervised reaction mode is the mode where health policies are active and recommendations on actions are sent to the administrator. If the administrator follows the recommendations, the only action required is selecting a button, and the actions are performed.
- Automatic
The automatic reaction mode means that health policies are active, logging data and the defined reaction is taken automatically.
Guided activities
We can use one of the guided activities to implement all necessary steps to create a health policy, enable and configure the health controller, view the runtime tasks, and enable e-mail notification.
The guided activity can be started by selecting...
Guided Activities | Defining policies...to detect and manage health conditions.
We can follow the steps in the guided activity or define all necessary steps by selecting them from their normal menu trees in the Administrative Console. We describe how to set up health monitoring using the Administrative Console menu structure in this chapter.
The health controller
To use health monitoring verify the health controller is enabled. It is enabled by default, but could have been disabled. Select...
Operational Policies | Autonomic Managers | Health Controller from the Administrative ConsoleOn this Administrative Console page we can also configure the behavior of our health controller:
- We can set the control cycle length in minutes (1-60), which means the time between two consecutive health checks to determine if health policy conditions have been breached. Longer control cycle lengths reduce the load caused by health monitoring. The disadvantage of long cycles is that it takes longer to detect a policy breach which occurs between the two cycles. We may vary here depending on the policies we have defined.
- In the Maximum Consecutive Restarts field we can enter the number of restart attempts that will be performed until an instance restart is declared as failed.
- The Restart Timeout field specifies the time in minutes a restart can take until it is a failure. The restart means the sequence of stopping and starting a server.
- The Minimum restart interval parameter controls the minimum amount of time that must pass between consecutive restarts of an application server instance. If a health condition for an application server is breached during this time, the restart is set to a pending state. The restart occurs when the minimum restart interval passes. The value can range from 15 minutes to 365 days, inclusive. A value of 0 disables the minimum restart value.
- Under Prohibited Restart Times we can define one or more time frames where no restart is allowed. This can be used to prevent servers from being restarted for example during our highest load times or when special functions are used that only run on an single machine. If a restart event is triggered during such a time frame it is postponed until after the end of the time frame. We must define the start and end time for every single row and select at least one day of week. We cannot define time frames over midnight, in this case we must define two separate time frames one until midnight and one starting at midnight.
Configuring the health controller using scripting
We can also define health controller settings using a script. It is called HmmControllerProcs.jacl (located in the /bin directory) and allows one to:
- Enable or disable the health management controller.
- Enable or disable automated restarts for the server.
- Set or get values for other health management settings.
Locating the health controller
After we have defined and enabled the health controller, it runs as part of the cell. There is one controller per cell running in the Node Agent of one non-Deployment Manager node. We can use the runtime topology to learn which node hosts the health controller. Select...
Runtime Operations | Runtime Topology | Node Group perspective...and expand the node tree until all nodes are displayed.
In the figure below the health controller is running as part of the Node Agent on node2 and is represented by the
icon.
Node group perspective showing health controller
Locating the health controller can also been done by a wsadmin jacl script. The checkHmmLocation.jacl script is located in the install_root/bin directory.
#./wsadmin.sh -f checkHmmLocation.jacl
WASX7209I: Connected to process "dmgr" on node dmgr1 using SOAP connector;
The type of process is: DeploymentManager looking for group name:
    HAMItemGroup:com.ibm.ws.xd.hmm.controller.HmmControllerImpl_com.ibm.ws.xd.hmm.controller.HmmController_Default
Results:
{SERVER_NAME nodeagent}
{MEMBER_NAME HAMItemMember:com.ibm.ws.xd.hmm.controller.HmmControllerImpl_com.ibm.ws.xd.hmm.controller.HmmController_Default_xdcell/node3/nodeagent_1}
{NODE_NAME node3}
{GROUP_ID HAMItemGroup:com.ibm.ws.xd.hmm.controller.HmmControllerImpl_com.ibm.ws.xd.hmm.controller.HmmController_Default}
In this example the health controller is now located on node3. We can see that the health controller can move through the entire cell, its location changing automatically.
Define health policies
To define a health policy select...
Operational Policies | Health Policies | NewThe first panel allows us to name the health policy and to select the policy type.
There are seven different policy types to select from:
- Age-based condition
- Excessive request timeout condition
- Excessive response time condition
- Memory condition: excessive memory usage
- Memory condition: memory leak
- Storm drain condition
- Workload condition
On the second panel, we can define the health condition properties (depending on the policy type), the reaction and the reaction mode. The conditions, their properties and available reactions are described in detail in the following sections.
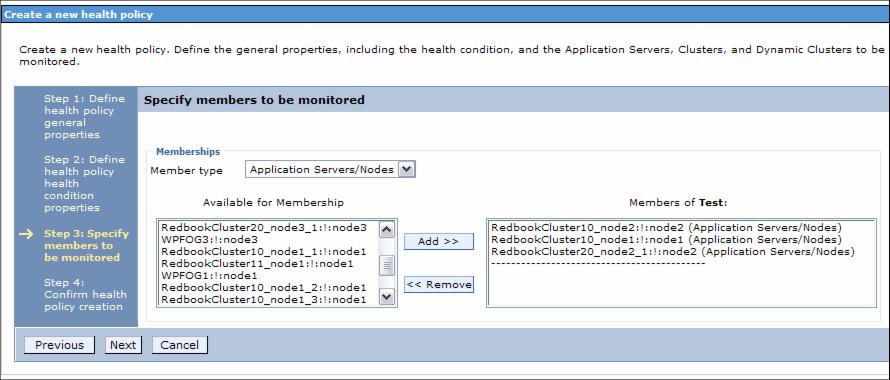
On the Specify members to be monitored panel select the member type...
- Application Servers/Nodes
- Clusters
- Dynamic Clusters
- Cells
Depending on the member type, the Available for Membership pane is populated and we can select members that belong to the member type.
The confirm health policy creation panel allows us to verify the information is correct.
Age-based condition
An age-based condition health policy monitors for servers that have been running longer than a configured time period. This is used to refresh the servers periodically, for example to prevent them from crashing in case of heap fragmentation.
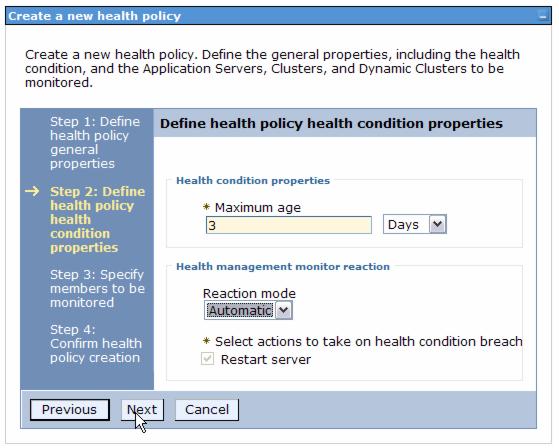
Defining an age-based conditioned health policy is very simple. We set the amount of time in hours or days and select if an event causes an automatic or supervised action.
The Maximum age field does not accept fractional numbers, so we must select hours if we want to specify half days. Acceptable values are 1 - 365.
The only possible action for an age-based condition is a server restart.
Age based condition properties
Excessive request timeout condition
This condition will detect, for each server that is a member of this policy, the percentage of timed out requests routed to this server by the On Demand Router. We configure the percentage of timed out requests to breach this condition and choose if the action is taken automatically or supervised.
There are two different actions available for the excessive request timeout condition and we can choose one or both of them. The possible actions are Restart server and Take thread dumps.
The option to take thread dumps is not supported for application servers running non-IBM JVMs. A warning will be displayed when we assign such servers to this policy.
Excessive response time condition
With the excessive response time condition, we can create a policy which can be used to discover hanging servers. When defining such a policy we can enter an average response time value from one millisecond to one hour. When this value is exceeded by a server to which this policy is assigned, a supervised or automatic server restart will be triggered.
Be careful with the automatic reaction mode. We could have a problem with external resources rather than with the servers themselves. For example, the database is not available and this causes high response times for all of our servers.
If we do not want our servers to be restarted automatically in such an event, then do not select the automatic reaction mode.
Memory condition: excessive memory usage
This condition creates policies that monitor each defined server for memory usage in excess of a specified percentage of that server's JVM heap size for a certain amount of time.
If there are too many events triggered by such a policy, change the servers heap size.
We must define the percentage of heap size usage that must be reached and how long the usage must stay on or above the given value to trigger the reaction. The only possible action is an automatic or supervised server restart.
The time period can be set from 1 second to 60 minutes to ensure that the policy only triggers when a server's memory usage is in excess of the threshold for a certain period of time.
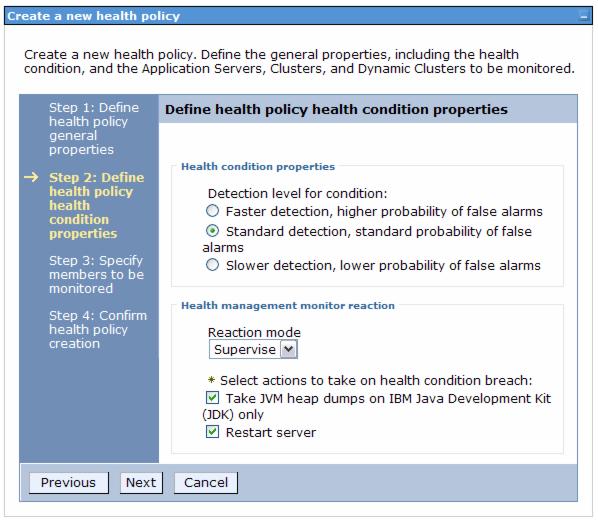
Memory condition: memory leak
The memory leak algorithm, which this policy monitors the servers for, profiles the java virtual machines' (JVM) heap size after a garbage collection has occurred and looks for trends of increased consumption.
There are three different detection levels which cause faster detection or lower probability of false alarms. The Slower detection needs more historical data than the other two. The Standard detection and the Faster detection use the same amount of historical data but the Faster detection can start the analysis even before the JVM has increased its heap to the maximum allowed heap size.
Possible actions when this health condition is breached are to restart the server and to take JVM heap dumps on IBM Java Developer Kit (JDK) only. We can select both or only one of these actions. This gives we the freedom to define two different health policies with the same detection level, but with different reactions. For example, we can create one policy to take JVM heap dumps automatically and another one which restarts the server in supervised mode.
Storm drain condition
The storm drain condition can be assigned only to dynamic clusters, therefore we can assign it only on cell and dynamic cluster level. This condition will detect for each cluster member a significant drop in the average response time coupled with changes to the dynamic workload manager weights for the cluster member. This helps to prevent the system to shift all the load to a faulty server with low response time.
The configuration steps are limited to choose only between...
- Standard detection, standard probability of false alarms
- Slower detection, lower probability of false alarms
Also we can select between an automatic or supervised server restart.
The detection levels work with different amounts of samples used to calculate the left and right mean of response times and dynamic workload manager weights. The standard detection works with 20 samples, the slower detection with 30 samples. The samples are taken in a 15 second interval therefore it takes 5 minutes for the standard detection and 7 minutes and 30 seconds for the slower detection to trigger the reaction.
As an example for the standard detection, the left mean is built by the 10 samples that have arrived before the current sample, the right mean is built by the 10 samples that arrive later including itself. The difference between the left and the right mean is stored and compared with other differences. When an unusual change is detected, this policy raises an health event.
Workload condition
Policies with workload conditions monitor servers for the total amount of requests that a server has already handled. We can configure the policy to restart a server automatically or in supervised mode if the given number of request has been handled by a server.
Default health policies (new in V6.0.1)
Starting with WebSphere XD Version 6.0.1, five predefined health policies are installed with the product. These default health policies are configured for cell-level and use the supervised reaction mode.We can modify the default policies to suit our environment, or delete them if they are not needed.
Because the default health policies monitor all the servers in supervised mode, these policies can be used as a first line of defense against health problems. We can define policies with more stringent settings or automated mode operation for particular servers or collections of servers in addition to the default policies. These default health policies are created at installation:
Default memory leak Default standard detection level. Default excessive memory Set to 95% of the JVM heap size for 15 minutes. Default request timeout Set for 5% of the requests timing out. Default excessive response time Set to 120 seconds. Default storm drain Default standard detection level.
Manage health policies with scripting
We can create, delete, and modify membership in health policies using the jython script,
install_root/bin/healthpolicy.py
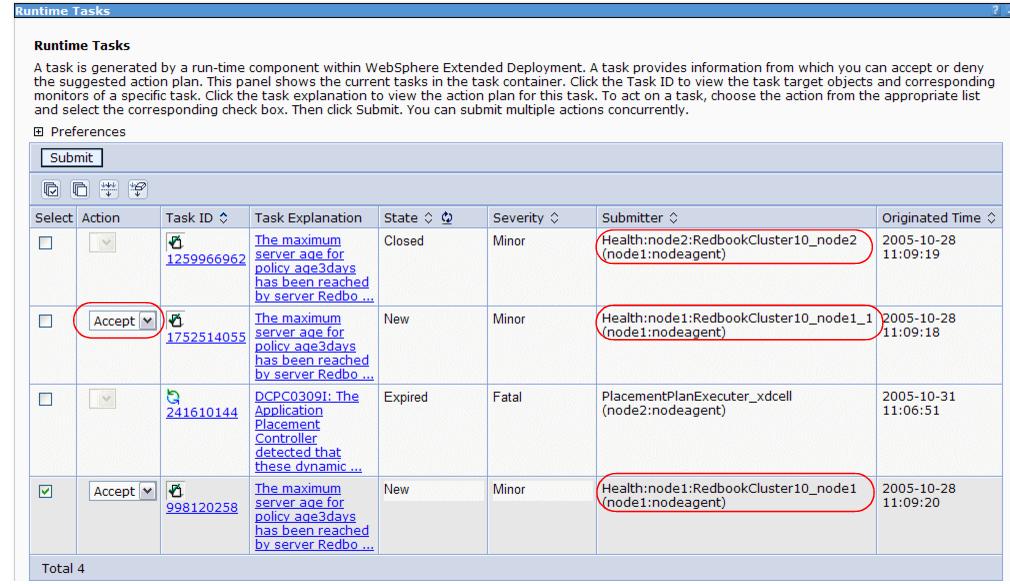
Monitor runtime tasks
After we have defined our health policies and enabled the health controller we can see whether events happened under...
Runtime Operations | Management | TasksIn the figure below we can see that tasks were performed automatically or are waiting for administrator intervention, depending on the configuration of the health policies.
When a health policy breach is detected by the health controller, an automatic or supervised task is created as defined in the corresponding health policy. The task steps are not only based on the health policy, there are also steps inserted based on decisions by other WebSphere XD components. To see which steps are planned for a task we can click the text under the Task Explanation column. If, for example, a health policy breach happens in a dynamic cluster, then the restart of the server will not be a real restart. The steps can look similar to the following.
    Step 1 : Start server RedbookCluster10_node1_1 on node node1.
    Step 2 : Stop server RedbookCluster10_node2 on node node2.
We can see that the start and stop action is planned on different nodes and it is based on the dynamic cluster settings. The different components act together to decide how a server restart must be managed. The environment ensures that no other rule, such as the minimum amount of running servers per cluster, is broken during a server restart. In this example, this is achieved by starting a new server before shutting down another one. The health policy breaking server is not restarted after the start of the new server and the stop of the health policy breaching server until other events are triggering a server start. This could be, for example, more workload or other health policy events that cause this server to take the place of another now unhealthy server.
Health monitoring tips
- Think about our peak load times and whether a health policy triggered action causes more problems than it solves during this time. Remember that we can define prohibited restart times.
- When rolling out a brand new application or a new version of an application we never know what to expect in production. Unexpected bugs might crop up regardless of what happened during testing. For some shakeout period IBM recommends setting up these prophylactic health policies for all new or updated applications:
- Memory Leak condition
- Excessive Request Timeout condition
The policies' action should start off in supervised mode until we learn whether there is a problem. After we know this, we can either turn the policies off or move to automatic mode.
- If our application causes a health condition breach then try to fix the problem within the application. Health monitoring is only a workaround to make our system more reliable, but it should not be the final solution. Using health monitoring should help us to survive until our application fixes are available.
- Health monitoring can help to make our environment more reliable but, like any automation feature, it should be used carefully. Health policies should only be defined and assigned to servers if we think it is possible that this health policy is actually needed.
Further information about health policies can be found in the product documentation for WebSphere Extended Deployment