Display cache information
Overview
The dynamic cache monitor is an installable web application that displays simple cache statistics, cache entries, and cache policy information for servlet cache instances.
Procedure
- Use the administrative console to install the cache monitor application from...
install_root/installableApps/CacheMonitor.ear

Installing the cache monitor on the admin_host is more secure than installing it on the default_host.

- If you installed the cache monitor on the admin_host, check if a web container transport chain has been created.
Application servers | servername | Web container settings | Web container transport chains
If a web container transport chain does not exist create a web container transport chain in the admin_host for this server.
- Add a host alias for the port your server is using. Click...
Environment | Virtual hosts | host_type | Host aliases

...and create a new Host name and Port to add to the list.
- Enable the dynamic cache service
- We can now access cache monitor using...
http://host:port/cachemonitor
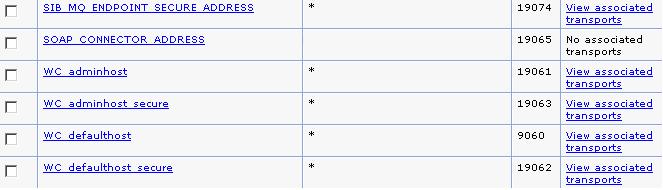
We can find the port number in the SystemOut.log file. Look for message TCPC0001I or SRVE0171I.
- Verify the list of cache instances that are shown. For each cache instance, one can perform the following actions:
Tip: You must select the servlet cache instance that you want to monitor. If you do not use servlet cache instances by using <cache-instance> tags in your cachespec.xml file, all the content is in the baseCache instance.
- View the Statistics page and verify the cache configuration and cache data. Click Reset Statistics to reset the counters.
- View the Cache Policies page to see which cache policies are currently loaded in the dynamic cache. Click on a template to view the cache ID rules for the template.
- View the Cache Contents page to examine the contents that are currently cached in memory.
- View the Edge Statistics page to view data about the current ESI processors configured for caching. Click Refresh Statistics to see the latest statistics or content from the ESI processors. Click Reset Statistics to reset the counters.
- View the Disk Offload page to view content that is currently off-loaded from memory to disk.
When you are viewing contents on memory or disk, click on a template to view all entries for that template, click on a dependency ID to view all entries for the ID, or click on the cache ID to view all the data that is cached for that entry.
- Use the cache monitor to perform basic operations on data in a
cache instance.
- Remove an entry from cache
- Click Invalidate when viewing a cache entry.
- Remove all entries for a certain dependency ID
- Click Invalidate when viewing entries for a dependency ID.
- Remove all entries for a certain template
- Click Invalidate when viewing entries for a template.
- Move an entry to the front of the Least Recently Used queue to avoid eviction
- Click Refresh when viewing a cache entry.
- Move an entry from disk to cache
- Click Send to Memory when viewing a cache entry on disk.
- Clear the entire contents of the cache
- Click Clear Cache while viewing statistics or contents.
- Clear the contents on the ESI processors
- Click Clear Cache while viewing ESI statistics or contents.
- Clear the contents of the disk cache
- Click Clear Disk while viewing disk contents.
See also
Cache monitor
Tuning dynamic cache with the cache monitor
Related Tasks
Task overview: Using the dynamic cache service to improve performance