If an appserver hangs or dies
Contents
- Isolate the Problem
- Run Tivoli Performance Viewer
- Verbose Garbage Collection
- HProf vs. IBM_HEAPDUMP
- Profile the heap with IBM heapdumps
Isolate the Problem
You can isolate the problem by installing Web modules on different servers
Run Tivoli Performance Viewer
Use TPV to determine which resources have reached their maximum capacity, such as Java heap memory (memory leaks and database connections.
If a particular resource appears to have reached its maximum capacity, review the application code for a possible cause...
- If database connections are used and never freed, ensure that application code performs a close() on any opened Connection object within a finally{} block.
- If there is a steady increase in servlet engine threads in use, review application synchronized code blocks for possible deadlock conditions.
- If there is a steady increase in a JVM heap size, review application code for memory leak opportunities.
Verbose Garbage Collection
As an alternative to using the performance viewer to detect memory leak problems, enable verbose garbage collection (verbose:gc) in the Java Virtual Machine.
Servers | Application Servers | server | Process Definition | Java Virtual Machine
...and then cycle the server.
On WebSphere, GC records are written to native_stdout.log.
[GC 325407K->83000K(776768K), 0.3400514 secs]
[GC 325816K->83372K(776768K), 0.3054352 secs]
[Full GC 267628K->83769K(776768k), 1.9542351 secs]
The first column is the size of live objects before the GC. The second is the size of live objects after the GC. The third column, in the parentheses, is the total available size of the Java heap, which is the total heap size minus one of the young generation's survivor spaces (used by the copying collector in the young generation). The last column is the time taken by this garbage collection pass.
To get all records from native_stdout.log where active live objects is greater than 300000, run...
sh ./GC.sh native_stdout.log
...where GC.sh contains...
xfile=$1

grep "^\[GC" $xfile | \
sed "s,->, ," | \
sed "s,(, ,g" | \
sed "s/),/ /g" | \
sed "s,^\[GC,," | \
sed "s,K,,g" > tmp.out

awk '$2 > 300000 {
    print "[GC " $1 "->" $2 "(" $3 "), " $4 " secs]"
}' tmp.out


grep "^\[Full GC" $xfile | \
grep -v Unloading | \
sed "s,->, ," | \
sed "s,(, ,g" | \
sed "s/),/ /g" | \
sed "s,^\[Full GC,," | \
sed "s,K,,g" > tmp.out

awk '$2 > 300000 {
    print "[Full GC " $1 "->" $2 "(" $3 "), " $4 " secs]"
}' tmp.out
If the heap isn't large enough to honor an allocation request, the JVM will resize the heap by extending its operating system's process footprint by some amount, up to the maximum specified by the -Xmx option to the JVM.
If, however, the old generation has plenty of room and it's just the young generation that's getting saturated, we can resize the young generation by using some underdocumented Sun-specific JVM tuning flags. By default, the young generation is set to be one-quarter the size of the entire heap; if you want to change this ratio, frequently to expand the size of the young generation, you can use the -XX:NewRatio flag, where the value passed to the flag is the ratio of the young generation to the old generation; for example, -XX:NewRatio=3 sets the young generation ratio to be 1:3 to the old generation, which gets us back to the default.
If you're looking for something a bit more fine-grained than a simple multiple of the total heap size, two more flags, NewSize and MaxNewSize, set bounds on the young generation just as the -Xms and -Xmx flags do for the entire heap as a whole. Be careful with this value, though--a young generation larger than half of the total size of the heap is allocating a lot of empty space to the young generation. The default NewSize on a Solaris JVM is 2172K, on a x86 640K. MaxNewSize is 32M on both platforms, which is typically too small, particularly if you've set the -Xmx option to be larger than 64M (the default). You can do the same for the old generation using the OldSize option, set to 1408K by default, and likewise for the permanent space using PermSize, 1M by default.
HProf vs. IBM_HEAPDUMP
If either performance viewer or verbose garbage collection output indicates that an appserver is running out of memory there might be a memory leak in your application code.
You can use either Hprof or IBM_HEAPDUMP, to generate heapdumps.
Hprof dumps display objects, their addresses and sizes, and Java stacks, which show where in code the objects were allocated.
IBM JDKs include IBM HEAPDUMP utility, which is a superset of the Hprof format. IBM_HEAPDUMP provides a less granular look at the memory usage.
If you are using the Solaris HotSpot JDK, rather than an IBM JDK, the IBM heapdump package referenced above will not work for you. Rather, what you want to use is IBM_HEAPUMP v1.4.1.
To determine which compiler you are using, check appserver startup information in...
/opt/WebSphere/AppServer/logs/SystemOut.log
For example...
WebSphere Platform 5.1 [JDK 1.4.1 b0344.02]
                       [BASE 5.1.0.3 cf30412.02]
                       [ND 5.1.0.3 cf30412.02]

Running with process name cellName\appserver\appserverA and process id 4372

Host Operating System is SunOS, version 5.8

Java version = 1.4.1_05
Java Compiler = null
Java VM name = Java HotSpot Client VM

was.install.root  = /opt/WebSphere/AppServer
user.install.root = /opt/WebSphere/AppServer
Java Home         = /opt/WebSphere/AppServer/java/jre
You cannot feed an IBM heapdump to an Hprof tool such as Heap Analysis Tool (HAT). Conversely, you cannot feed an Hprof dump to an IBM heapdump tool. You must choose the format (Hprof or IBM) of the heapdump generated by your JVM.
IBM heapdumps do not show where in the Java code objects are allocated, or relate objects that were allocated at the same time or in the same Java method. Like Hprof dumps, they show object relationships, that is, who has pointers to whom. This can be important, since it is these relationships which prevent objects from being garbage-collected.
In general, Hprof dumps are more direct in pinpointing memory leak issues, because they show where in the code objects are allocated, and show combined memory size and occurrences for all objects allocated in the same code location.
Unfortunately, enabling Hprof causes significant performance degradation, which may skew test results and even prevent certain large applications from starting. IBM heapdumps exhibit much better performance.
Profile the heap with Hprof
To pinpoint the cause of a memory leak- Go to...
Servers | Application Servers | server_name | Process Definition | Java Virtual Machine
- Check Run Hprof and specify format=b in the box below that for Hprof Arguments.
You want format=b to generate a binary file, which can parsed by the Heap Analysis Tool.
- Save the configuration and restart the appserver.
If you get a message on the console about not being able to invoke a SOAP RPC call, that might not be bad. Check the log files. The server might start anyway. If the log file shows the server has started, log out of the console, log back in, and see a green started status light for the server.
- Run the application that causes the leak.
- Using the wsadmin command, get a handle to the problem appserver as follows:
set jvm [$AdminControl completeObjectName type=JVM,process=server_name,*]
- Generate a thread dump (which also triggers Hprof, if enabled):
wsadmin>$AdminControl invoke $jvm dumpThreads
- This file will be written to the default working directory, unless it is overridden in...
AdminConsole | targetserver | General tab | Working directory
If you are unable to start your appserver with HProf enabled, trying running:
rm $WAS_HOME/tranlog/servername/*
Of course, you cannot do this if you have production data....
Configure from Commandline
You can also set HProf on by running:
wsadmin.sh -username was -password notiv@ -f set_HProf.jacl cell node server
Default behavior
A header is written to java.hprof.txt when the Java process starts. A complete memory profile output, or heapdump, is appended when the Java process exits.
Incremental heapdumps are added if a signal is sent to the running Java process; for example, kill -3 JavaProcessPID.
Enabling heap profiling slows down a Java process significantly. At the time of this writing, no quantification had been made to evaluate the magnitude of this performance degradation. A good practice is to reproduce a memory leak condition in a test environment. You should take the performance degradation caused by enabling heap profiling into consideration and measure it while in pre-production before you enable it on a production system.
Creating and reading heapdumps using Hprof
Begin by looking at the statistical report toward the bottom of the heapdump, with the section titled SITES
BEGIN:
SITES BEGIN (ordered by live bytes) Wed Apr 02 07:13:47 2003
percent live alloc'ed stack class

rank    self    accum    bytes      objs       bytes    objs    trace    name
1     99.76%    99.76%   125829168    12   125829168      12     2695      [C
2      0.03%    99.79%   32776         2       32776       2     1366      [C
3      0.01%    99.80%   16392         2       16392       2     1364      [B
4      0.01%    99.81%   16032         102     16240     112        1      [C
...
SITES END
The self column shows what percentage of live bytes are due to that row, and accum shows the percentage of memory due to all rows up to and including that row (which are presented in descending order by amount of memory allocated). Therefore, in the table above, 99.76% of all live, non-collectable, bytes are due to 12 character arrays, which were allocated at stack trace #2695. 0.03% of live bytes were due to character arrays allocated at stack trace #1366.
Live versus alloc'ed distinguishes non-collectable, currently live objects from all objects ever allocated, whether currently live or previously garbage-collected, at a particular call site. Look for rows that have live values nearly equal to alloc'ed values, which is a sign that an allocation site is responsible for a leak.
Problems with memory leaks often surface in the SITES section. As seen above, one or two sites are often responsible for the vast majority of the total allocated memory.
Once a suspicious site has been found, look at its number in the stack trace column. Then go to the TRACE section in the file and look for that trace number. It will list the methods responsible for the allocation.
The difficulty with this information is that low-level objects, such as character arrays, float to the top. The really helpful objects such as heads of leaking data structure are far fewer in number, and will be somewhere far down the list. Locating those is sometimes difficult. This is where third party vendor tools come in handy.
HProf Options
To see available options, from the command-line, run:
java -Xrunhprof:help
...which generates...
heap=dump|sites|all Tells hprof to generate stack traces, from which you can see where memory was allocated. If you use the heap=dump option, you get a dump of all live objects in the heap. With heap=sites, you get a sorted list of sites with the most heavily allocated objects at the top. cpu=samples|times|old Generate information that is useful in determining where the CPU spends most of its time. If cpu is set to samples, the JVM pauses execution and identifies which method call is active. If the sampling rate is high enough, you get a good picture of where your program spends most of its time. If cpu is set to times, you receive precise measurements of how many times each method was called and how long each execution took. Although this is more accurate, it slows down the program. The cpu=old option provides an output format that is backward-compatible with an older version of the tool. monitor=y|n Implement thread synchronization, so getting information on monitors can tell you how much time different threads are spending when trying to access resources that are already locked. Hprof also gives you a snapshot of the monitors in use. This is very useful for detecting deadlocks. format=a|b The default is for the output file to be in ASCII format. Set format to b if you want to specify a binary format, which is required for some utilities such as the Heap Analysis Tool. file=filename Change the name of the output file. The default name for an ASCII file is java.hprof.txt. The default name for a binary file is java.hprof. net=host:port Send the output over the network rather than to a local file. depth=size Indicates the number of method frames to display in a stack trace (the default is 4). thread=y|n If set y, the thread ID is printed beside each trace. This option is useful if it is not clear which thread is associated with which trace. This can be an issue in a multi-threaded application. doe=y|n The default behavior is to write profile information to the output file when the application exits. To collect the profiling data during execution, set doe (dump on exit) to n and use one of the methods (wsadmin, DrAdmin or kill -3) described in section Enabling Hprof output.
Save the settings and cycle the appserver.
HProf Debugging
Re-enact the scenario or access the resource that causes the hang or crash, if possible. Stop the appserver. If this is not possible, wait until the hang or crash happens again and stop the application server.
Examine heapdmp.txt and search for the string, "SITES BEGIN". This finds the location of a list of Java objects in memory, which shows the amount of memory allocated to the objects.
The list of Java objects occurs each time there was a memory allocation in the JVM. There is a record of what type of object the memory instantiated and an identifier of a trace stack, listed elsewhere in the dump, that shows the Java method that made the allocation.
The list of Java object is in descending order by number of bytes allocated. Depending on the nature of the leak, the problem class should show up near the top of the list, but this is not always the case. Look throughout the list for large amounts of memory or frequent instances of the same class being instantiated. In the latter case, use the ID in the trace stack column to identify allocations occurring repeatedly in the same class and method.
Increase max heap size
The default maximum heap size of the appserver needs to be increased.
Appserver spontaneously dies
If an appserver spontaneously dies, look for a Java thread dump file. The JVM creates the file in the product directory structure, with a name like javacore[number].txt.
To force an application to create a thread dump (or javacore):
- Using the wsadmin command prompt, get a handle to the problem application
server:
wsadmin>set jvm [$AdminControl completeObjectName type=JVM,process=server,*]
- Generate the thread dump:
wsadmin>$AdminControl invoke $jvm dumpThreads
- Look for an output file in the installation root directory with a name like javacore.date.time.id.txt.
If the JVM creates the thread dump as it closes (the thread dump is not manually forced), there might be "error" or "exception information" strings at the beginning of the file. These strings indicate the thread that caused the appserver to die.
The thread dump contains a snapshot of each thread in the process, starting in the section labeled "Full thread dump."
- Look for threads with a description that contains "state:R". Such threads are active and running when the dump is forced, or the process exited.
- Look for multiple threads in the same Java application code source location. Multiple threads from the same location might indicate a deadlock condition (multiple threads waiting on a monitor) or an infinite loop, and help identify the application code with the problem.
Profile the heap with IBM heapdumps
With the IBM JRE, you can enable high performance heap profiling and obtain heapdumps by setting the process environment variable IBM_HEAPDUMP to true. The performance degradation is minimal, generally no more than a 1-5% decrease in response time.
To activate the Heapdump feature, set either the IBM_HEAPDUMP or the IBM_HEAP_DUMP environment variables to true before starting the JVM.
Note: For WebSphere on Solaris, the Heapdump described here will not work. Rather, see, IBM HeapDump for Solaris.
When a heapdump is written to the heapdump file, you will typically see the following in the standard error (stderr) stream:
Writing Heap dump ....
Written Heap dump to somepath.YYYYMMDD.HHMMSS.PID.txt
Note that he IBM_HEAPDUMP fails sliently if run-as user does not have permissions to write to the output dir.
To enable IBM heapdump output on Application Server 5.0 distributed, go to...
Admin Console | Servers | Application Servers | server_name | [Configuration Tab] | Process Definition | Environment Entries | New
...and add the following Name/Value pairs
Name Value IBM_HEAPDUMP true IBM_HEAP_DUMP true IBM_HEAPDUMPDIR /directory/path IBM_JAVACOREDIR /directory/path IBM_HEAPDUMP_OUTOFMEMORY true IBM_JAVADUMP_OUTOFMEMORY true JVM_THREAD_DUMP_BUFFER_SIZE 419430400
This mechanism uses the same signal handler as javacore processing, so not have DISABLE_JAVADUMP set as an environment variable.
For non-Network Deployment, set variables in setupCmdLine.sh also.
Save changes to the master configuration and cycle the server.
The heap dump is written to the current directory, WAS-Root/bin, or the directory specified by the IBM_HEAPDUMPDIR environment variable. The file that is generated is called heapdumppid.time in internal format txt. This file can be very large; allow for at least the maximum heap size. If the maximum heap is set to 512 MB, allow for .5 GB for the dump. This mechanism uses the same signal handler as javacore processing, so do not have DISABLE_JAVADUMP set as an environment variable.
In the Name field, enter IBM_HEAPDUMP. In the Value field, enter true. Save the configuration and restart the appserver.
Invoke a Heap Dump
To obtain an incremental IBM heapdump, run the following in wsadmin...
set jvm [$AdminControl completeObjectName type=JVM,process=server1,*]
$AdminControl invoke $jvm dumpThreads
The dump file will be created in the WAS_HOME directory under the name...
javacore.yyyymmdd.mmmmmm.nnnn.txt
Another way you can invoke the IBM heapdump mechanism is by sending a signal to the JVM. First get the PID of the process, for example...
/usr/ucb/ps -auxwwwwww | grep appserver
Then send a kill command to the PID...
kill -QUIT JVM_Process_ID
...or...
kill -3 JVM_Process_ID
The JVM will temporarily stop processing and invoke the heapdump mechanism.
Automatically Invoking on an OutOfMemoryError
You can arrange for an IBM heapdump to be generated automatically when an OutOfMemoryError condition is encountered in the JVM by setting the IBM_HEAPDUMP_OUTOFMEMORY environment variable to true before launching the JVM.
If you have enabled verbosegc in the JVM, also see the message "totally out of heap space" right before the OutOfMemoryError appears and the IBM Heapdump is triggered. Here is an example of what you will see:
<AF[5]: totally out of heap space>
Writing Heap dump ....
Written Heap dump to D:\Code\memtest\heapdump.20021104.163757.2312.txt
<AF[5]: completed in 769 ms>
java.lang.OutOfMemoryError
Invoking through special code
You can invoke the heapdump mechanism with Java code. This is easily done by invoking the static method HeapDump() in com.ibm.jvm.Dump. In the following example, the code first calls System.gc() to invoke the garbage collector to clean the unreferenced objects off the heap and then calls HeapDump() to generate a dump:
System.gc();
com.ibm.jvm.Dump.HeapDump();
The code invokes the garbage collector before the heapdump because on older JVMs, an IBM heapdump also dumps objects that are ready to be garbage-collected. This pollutes the dump with useless objects. Starting with JVM 1.4.1, the garbage collection is automatically invoked right before the heapdump, which means that the heapdump never contains garbage-collectable objects.
Reading IBM heapdump output
Unlike an Hprof-type heapdump, an IBM heapdump file is simple and homogeneous: except for one statement at the beginning of the file and one at the end, the entire content consists of one- or two-line entries, all in the same format.
The first line of the heapdump identifies the dumping JVM:
// Version: J2RE 1.3.1 IBM Windows 32 build cn131-20021107
The last line displays totals of each category of allocation in the dump: classes, objects, arrays of primitives, and arrays of objects:
// EOF: Total: 212945 Classes: 5141 Objects: 142218 ObjectArrays: 16193
PrimitiveArrays: 49393 //
The body of the dump consists of entries in the following form...
hex-address1 [size] type object-name...where...
hex-address2 hex-address3 hex-address4 ... hex-addressN
hex-address1 Location within the JVM of the allocated object. size Amount of memory it represents, in bytes. This is only the amount of memory allocated to represent the object itself, and does not include memory used by other objects to which it refers. type Meta-class of the object: class, object, array of object, or array of primitives object-name Top of the class, or the name of the object, that was allocated
The next hex addresses (if any), indented on the next line, represent the locations of objects pointed to by this object.
For example...
0x007ede18 [256] class java.lang.Package
0x00a24190 0x00a24200 0x00a242c8
...means that the class java.lang.Package was loaded at location 0x007ede18, that it takes up 256 bytes, and that this class object holds references to three other objects. You can search the heapdump for details on these other objects. Searching on the address 0x00a24190, you'll find the following entry:
0x00a24190 [56] java/util/HashMap
0x00a24158
In other words, the class java.lang.Package holds a reference to an object of class java/util/HashMap, which takes up 56 bytes. This object in turn has a reference to another object at location 0x00a24158, which takes up an additional amount of memory.
Would removing the class java.lang.Package, through garbage collection, have removed this particular instance of java/util/HashMap from memory? Not necessarily. In order to determine this, you would have to search the dump for all objects that contained references to the HashMap's location of 0x00a24190.
Examples of the other kinds of objects represented in IBM heapdumps are arrays of primitives:
0x00a24570 [128] primitive array
and arrays of objects:
0x00a24158 [56] array of java/util/HashMap$Entry
Here are a few notes about the IBM heapdump files:
- There is no particular ordering in the entries, such as time allocated, size, or object relationship.
- There is no combining of data by object type. Each allocation of a String object, for example, is shown separately.
- There is no indication of where, in the Java code, an allocation occurred.
- IBM heapdumps do not contain GCRoot information. This means that:
- Objects ready for garbage collection will be included in the dump but not identified as such.
- Objects referenced only by local methods and with JNI global references will show up as independent trees (generally thousands more than really exist).
Unlike Sun heapdumps, IBM heapdumps do not map memory allocation to Java code, nor do they include tables that clearly show which threads are responsible for taking up the biggest chunk of memory.
You'd have to be a cyborg, or seriously disturbed individual, to be able to read the raw file and understand what objects were related to a memory problem. However, on the plus side, IBM heapdumps represent a much lighter performance burden on the JVM and may therefore be more acceptable for diagnosing memory problems in a production environment.
But, you may ask, if you can't interpret them, what good are they? You need a tool to interpret them. That tool is HeapRoots, discussed in the following section.
Interpreting IBM heapdump output using the HeapRoots tool
The HeapRoots tool is a post-processor program that reads a dump produced with the IBM_HEAPDUMP option, collates information based on object size, occurrences, and links, and enables you to view the information in various ways. HeapRoots reads only heaps created using the IBM_HEAPDUMP option on the JVM; it does not process Hprof-type heapdumps.
To obtain the HeapRoots tool, go to...
http://www.alphaworks.ibm.com/tech/heaproots
Once you have the HeapRoots JAR file, you can invoked it at any command prompt as follows (a Java version 1.2 or later must be in the path)...
java -jar HRnn.jar heapdumpfilename
...here HRnn is the name of the HeapRoots jar file, which depends on the version. The output is large enough that you will want to redirect the output to a file or (on Unix) pipe it to a more or similar utility. A fragment of HeapRoots output follows:
<0> 0x007ec118 [1,364,912/29,455] class java/util/jar/JarFile
2 children smaller than 1,048,576 total size/desc: 97,888/1,974
<1> 0x00951650 [1,266,856/27,480] java/util/Vector
<2> 0x02f066c0 [1,266,824/27,479] array of java.lang.Object
367 children smaller than 1,048,576 total size/desc: 1,265,288/27,112
<0> 0x0094fc60 [28,612,016/507,751] array of
com/ibm/ws/classloader/ReloadableClassLoader$CacheEntry
6 children smaller than 1,048,576 total size/desc: 336/6
<1> 0x01fd6fe8 [28,611,968/507,750]
com/ibm/ws/classloader/ReloadableClassLoader$CacheEntry
2 children smaller than 1,048,576 total size/desc: 184/1
<2> 0x034a9b10 [28,611,936/507,749] com/ibm/ws/classloader/JarClassLoader
10 children smaller than 1,048,576 total size/desc: 4,184/61
<3> 0x034a9a10 [28,607,696/507,679] com/ibm/ws/classloader/CompoundClassLoader
15 children smaller than 1,048,576 total size/desc: 263,632/3,087
This fragment shows two root objects, objects which have no parents, or objects which refer to them. These are the class jar file, and an array containing instances of the...
com/ibm/ws/classloader/ReloadableClassLoader$CacheEntry
...class. The JarFile class is a parent (including all of its descendants) of 29,455 objects, taking over 1 MB of memory.
The array of CacheEntry objects is responsible for 597,751 objects and more than 28 MB of memory. It points to seven objects directly, but of these, six take up less than the 1 MB threshold. In fact the collective size of these six objects, including their descendants, is only 336 bytes. The seventh object is an instance of...
com/ibm/ws/classloader/ReloadableClassLoader$CacheEntry
...no doubt an element in the array.
Obviously it is responsible for the bulk of memory held onto by its parent. It has three immediate children, of which one is, in turn, responsible for the rest of its parent's subtree. The numbers on the left help you keep track of how far into a root object's sub-tree you are.
By default, root objects are displayed in order by address rather than size.
If you were to browse the entire contents of the HeapRoots output, you would have to go quite far (at least in this case) to find what most of that 28 MB is being used for -- even deeper than the 64 levels to which HeapRoots by default limits its display! The HeapRoots command gives you options to refine what you want to see and how you want to see it. You can see these options by entering the command without a file name:
HeapRoots version 2.0.0 Usage: java -jar[opts] [opts]
opts are:
-e <encoding>        - file encoding (use ISO8859_1 for ASCII on OS/390)
-t <bytes>           - set threshold of object size, default 1048576
-d <depth>           - set max depth for output, root-depth=0, default 64
-a <0xaddr>          - only dump object at specified address
-i                   - interactive use
-v                   - verbose mode
You could iteratively display the output and re-enter the HeapRoots command with these options to get to the heart of a memory problem. However, a better, faster approach is to use the interactive mode of HeapRoots, described below, to refine the data.
Memory and performance problems with HeapRoots
HeapRoots itself uses a large amount of memory in order to construct its model of memory usage. The precise amount of memory it uses depends upon the data in the input heapdump. It makes sense to use HeapRoots on a machine with a large amount of main memory. If you still experience very slow performance, or HeapRoots exits with java.lang.OutOfMemoryError exceptions, try adding the -XmxN option to the invocation of HeapRoots, where N is the amount of memory, in megabytes, to give to the JVM running HeapRoots. A rule of thumb given by the HeapRoots author is to specify about 80% of the main memory amount of the machine on which you are running HeapRoots. For example, on a machine with 512 MB of main memory:
java -Xmx400m -jar Heaproot200.jar heapdump.txt
Using HeapRoots in interactive mode
The interactive mode of HeapRoots enables the tool to build a tree of heap objects in memory, and enables you to query that tree quickly in various ways without reloading the raw heap file. It does not mean you can interactively explore a running JVM's heap; you need to specify an existing heapdump file you want to process.
To launch the HeapRoots command prompt and load a heapdump file, enter the HeapRoots command with the -i option:
java -jar heaproots.jar OutputFile.txt -i
where heaproot.jar is the name of the HeapRoots jar file on your system and OutputFile.txt is the file that will contain the results.
You will be rewarded with a set of statistics about your heap:
Comments : // Version: J2RE 1.3.1 IBM Windows 32 build cn131-20021107
//
EOF: Total: 639922 Classes: 7908 Objects: 453837 ObjectArrays: 62321 PrimitiveArrays:
115856 //
# Objects : 639,922
# Refs : 988,571
# Unresolved refs : 33
Heap usage : 36,790,984
Est. Heap size : 397,090,048
Extra stats : unavailable before processing
Memory Usage : 23/30 mb
Est. Heap size is the total difference between the lowest and highest address in the dumped JVM's memory. Since an Application Server JVM typically uses multiple heaps in separate locations, this figure is liable to be several times the real amount of Application Server memory usage and should be ignored. Memory
Usage denotes the memory used by the HeapRoots tool itself.
The first command execute after launching HeapRoots is the p command. This command has two effects:
- It causes HeapRoots to construct an object tree in memory for further analysis.
- It creates a compressed state file containing the tree information, so that the next time you launch HeapRoots against this dump, the tree will not have to be reconstructed. (HeapRoots will first look for the state file when it is launched).
Now you can filter your view of the dump in various ways. To see a basic picture of object trees for each root object, similar to what you would see when dumping the output non-interactively, execute the d command.
To see a list of available commands, type help:
> help

Help:

oa/os/on/ot/od         show info on objects by addr/size/name/total size/descendants
ts/tc                  show info on types by total size/count
gs/gc                  show gaps by size/count
i                      show info on a single object
p                      process
d                      dump from roots/single object
stats                  show stats
save                   save state for quick reload
clear                  clear processed data
return                 repeat last command
x exit

Enter: o[a,s,n,t,d], t[s,c], g[s,c], i, p, d, x or help for more info
Where do you start when trying to interpret a heapdump? A good first step is to view root objects, and their total tree sizes only. To do this, use the ot command.
> ot
Enter name to filter on or '-' for no filterting [-]
Enter combination of types to show, R for Roots, A for Artificial Roots, N for Non-
Roots [R,N,A]
RA
Enter address range in format 'M','L-U','-U' or 'L-' [0x00000000-0xfffffff8]

Enter range of lines to print in format 'M','L-U','-U' or 'L-' [1-25]
Addr. Size Root-Owner Subtree Size Descend. Name R 0x0094fc60 48 - 28,612,016 507,751 array of com/ibm/ws/classloader/ReloadableClassLoader$CacheEntry R 0x007ec118 256 - 1,364,912 29,455 class java/util/jar/JarFile R 0x007e5e18 256 - 806,928 15,020 class com/ibm/jvm/ExtendedSystem R 0x007e5d18 256 - 209,512 2,595 class java.lang.System R 0x13d00b18 256 - 105,824 120 class com/ibm/rmi/iiop/CDROutputStream R 0x01526308 32 - 66,128 478 java/util/HashMap$Entry R 0x05228760 32 - 65,744 466 java/util/HashMap$Entry R 0x02ee35b0 32 - 65,360 440 java/util/HashMap$Entry R 0x007e9018 256 - 53,504 1,558 class sun/io/CharacterEncoding A 0x04a47228 72 - 51,312 56 com/ibm/ws/management/connector/soap/SOAPConnection R 0x029d91b8 24 - 51,288 1,791 array of java/util/ResourceBundle R 0x0131d628 64 - 49,600 1,079 array of java.lang.Object
(27051 matches but only displayed up to 25.)
Matched objects : 27,051 / 639,922
Total Size : 1,882,320 / 36,790,984
Total Subtree Size : 36,790,984
Total Descendants : 612,871
Enter: o[a,s,n,t,d], t[s,c], g[s,c], i, p, d, x or help for more info
>
In this example, you entered ot. You accepted the default values except for types to show, which you modified from R,N,A to R,A. This means that you want to see Root and Artificial Root objects only.
An Artificial Root is not a root object in the strictest sense, since another object has a reference to it, but one which HeapRoots detects as being the holder of an object tree, nonetheless. It may be, for example, that it is only referred to by a backward pointer from one of its own children.) This results in a list of the roots of the 25 largest object trees. In this example you can see that the array of com/ibm/ws/classloader/ReloadableClassLoader$CacheEntry that you saw in the initial dump is indeed far and away the root of the biggest object tree. To dig further into this object tree only, you can use the d command again, but this time, only show the descendants of a single root:
Enter: o[a,s,n,t,d], t[s,c], g[s,c], i, p, d, x or help for more info > d Enter threshold [1048576] Enter max depth or -ve for unlimited [64] Enter 0xto dump from one address or any value for all roots [0x0094fc60] 0x0094fc60
However, you may find that even dumping one object tree down to its leaves presents too much information to be useful. To see quickly which sub-trees are responsible for the greatest amount of memory limit the depth (as here, to 4):
Enter: o[a,s,n,t,d], t[s,c], g[s,c], i, p, d, x or help for more info
> d
Enter threshold [1048576]
E nter max depth or -ve for unlimited [64]
4
Enter 0x to dump from one address or any value for all roots [0x0094fc60]
0x0094fc60
threshold is 1048576 bytes
max depth is 4 levels
Dumping object at 0x0094fc60
<0> 0x0094fc60 [28,612,016/507,751] array of
com/ibm/ws/classloader/ReloadableClassLoader$CacheEntry
6 children smaller than 1,048,576 total size/desc: 336/6
<1> 0x01fd6fe8 [28,611,968/507,750]
com/ibm/ws/classloader/ReloadableClassLoader$CacheEntry
2 children smaller than 1,048,576 total size/desc: 184/1
<2> 0x034a9b10 [28,611,936/507,749] com/ibm/ws/classloader/JarClassLoader
10 children smaller than 1,048,576 total size/desc: 4,184/61
<3> 0x034a9a10 [28,607,696/507,679] com/ibm/ws/classloader/CompoundClassLoader
15 children smaller than 1,048,576 total size/desc: 263,632/3,087
<4> 0x014bfdb0 [28,343,952/504,577] com/ibm/ws/classloader/ExtJarClassLoader
15 children smaller than 1,048,576 total size/desc: 17,280/90
<4> 0x014bfdb0 [28,343,952/504,577] com/ibm/ws/classloader/ExtJarClassLoader
<3> 0x014bfdb0 [28,343,952/504,577] com/ibm/ws/classloader/ExtJarClassLoader
<3> 0x014bfdb0 [28,343,952/504,577] com/ibm/ws/classloader/ExtJarClassLoader
From this dump, you can see that the majority of memory appears to belong to an instance of class com/ibm/ws/classloader/ExtJarClassLoader at address 0x14bfdb0. The fact that it appears multiple times and at different levels presumably means that there are multiple references to the same object. At this point you can further investigate the heap by running the d command again, this time starting with the ExtJarClassLoader object's address:
Enter: o[a,s,n,t,d], t[s,c], g[s,c], i, p, d, x or help for more info
> d
Enter threshold [1048576]
Enter max depth or -ve for unlimited [4]
E
nter 0x to dump from one address or any value for all roots [0x0094fc60]
0x14bfdb0
threshold is 1048576 bytes
max depth is 4 levels
Dumping object at 0x014bfdb0
(
Root is 0x0094fc60)
<0> 0x014bfdb0 <28,343,952/504,577> com/ibm/ws/classloader/ExtJarClassLoader
15 children smaller than 1,048,576 total size/desc: 17,280/90
<1> 0x00911818 <28,338,296/504,473> com/ibm/ws/classloader/ProtectionClassLoader
6 children smaller than 1,048,576 total size/desc: 568/6
<2> 0x00913fc0 <28,337,640/504,460> com/ibm/ws/bootstrap/ExtClassLoader
14 children smaller than 1,048,576 total size/desc: 618,448/11,130
<3> 0x00ba0e18 <27,843,480/494,140> java/util/Vector
<4> 0x03d82440 <27,843,448/494,139> array of java.lang.Object
5948 children smaller than 1,048,576 total size/desc: 5,321,216/69,051
<2> 0x00913fc0 <28,337,640/504,460> com/ibm/ws/bootstrap/ExtClassLoader
<1> 0x00911818 <28,338,296/504,473> com/ibm/ws/classloader/ProtectionClassLoader
There is an array of Objects at 0x03d82440. It is holding on to 5948 small objects -- smaller than 1 MB -- that account for 5 MB of memory - almost one fifth of the heap.
What would it take for this object array to get garbage-collected? You can use the i command, or single object dump, to see a list of everyone holding references to this object, as well references this object has to others. Because of the way that HeapRoots displays output, listing the parent address after all the child addresses, you need to list all the references, or at least the last few, to make sure that you see the parents listed. A range of n- means "from line n forward." You knew frhom a previous command that this object had 5950 children and one parent, so here you are asking to see the last six children plus the parent:
Enter: o[a,s,n,t,d], t[s,c], g[s,c], i, p, d, x or help for more info
> i
Enter 0x for object to show info on [NONE]
0x03d82440
Enter range of lines to print in format 'M','L-U','-U' or 'L-' [5940-]
5945-
(Displaying from match 5945.)
REFERENCES FROM / CHILDREN of 0x03d82440
Addr. Size Name
------------------------------------------------------------------
0x0090f510 256 class com/ibm/ws/exception/RuntimeWarning
0x0090f610 256 class com/ibm/ws/exception/ConfigurationWarning
0x0090f910 256 class com/ibm/ws/exception/ConfigurationError
0x0090f810 256 class com/ibm/ws/exception/WsException
0x0090f710 256 class com/ibm/ws/exception/WsNestedException
0x0090fa10 256 class com/ibm/ws/runtime/WsServer
REFERENCES TO / PARENTS of 0x03d82440
Addr. Size Name
------------------------------------------------------------------
0x00ba0e18 32 java/util/Vector
Total refs : 5,951
Parents, Children : 1 , 5,950
Root Type : N
Root-Owner : 0x0094fc60
Total size : 27,843,448
Descendants : 494,139
Size : 40,976 / 36,790,984
To see where the rest of the memory is going, you can dive further into the tree by running the d command against this address, repeating the process until you see another single object (or array) that accounts for a major chunk of memory--in other words, where the amount of the total size for an object drops dramatically beyond that object's own level.
You may not be able to discover a single object or array that accounts for a large amount of memory. For example, a memory leak may be caused by allocation of the same kind of object, over time, under different parents. This means that the leaking, non-garbage-collected objects are scattered throughout the JVM heap. To look for this kind of leak, use the ts and tc commands to see the which kinds of objects, taken together, are accounting for the most amount of memory and the largest number of objects, respectively:
> ts
Enter name to filter on or '-' for no filterting [-]
Enter range of lines to print in format 'M','L-U','-U' or 'L-' [1-25]
A
pproximate matches ...
Count Size Name
------------------------------------------------------------------
115,856 14,669,960 primitive array
115,806 3,705,792 java.lang.String
71,704 2,294,528 java/util/HashMap$Entry
19,608 1,739,088 array of java/util/HashMap$Entry
25,508 1,459,288 array of java.lang.Object
34,286 1,097,152 java/util/Hashtable$Entry
39,387 945,288 com/ibm/ejs/util/Bucket
15,835 886,760 java/util/HashMap
14,156 679,488 com/ibm/etools/emf/ref/impl/RefBaseObjectHelperImpl
5,694 545,312 array of java/util/Hashtable$Entry
5,506 220,240 com/ibm/etools/emf/ref/impl/FastOwnedListImpl
9,137 219,288 java/util/ArrayList
4,344 208,512 java/util/Hashtable
6,164 197,248 com/ibm/ejs/util/cache/Bucket
10,707 171,312 java.lang.Integer
9 157,728 array of com/ibm/ejs/util/Bucket
2,278 145,792 org/apache/struts/util/FastHashMap
2,180 139,520 com/i../WAS51/pmi/stat/CountStatisticImpl
5,523 132,552 java/util/jar/Attributes$Name
33 132,424 array of com/ibm/disthub/impl/util/FastHashtableEntry
3,043 121,720 com/ibm/etools/emf/ecore/impl/ENamedElementImpl
1,233 118,368 com/i../WAS51/pmi/stat/TimeStatisticImpl
7,232 115,712 java.lang.Object
852 102,240 com/ibm/etools/emf/ecore/impl/EAttributeImpl
2,438 84,216 array of java.lang.String
(10864 matches but only displayed up to 25.)
Matched types : 10,864 / 10,864
Usage count : 639,922 / 639,922
Total size : 36,790,984 / 36,790,984
If a memory leak is occurring, you will often see one object type that accounts for the vast majority of the number of objects, memory, or both. If such an object's type is a Java or WebSphere base class, you may need help from WebSphere technical support to understand the source of the problem. However, if the leaking object is an application's class, it is likely that the leak is caused by application code. In this case, after identifying the object's class, you can go back through the object tree produced by the d command to find object instances, then use the i command to find all of its parents, as discussed above. At that point, you will still need to contact your application's developers to have them determine and correct the source of the leak in their code, but this information will give them a big head start. An example of using HeapRoots to diagnose a memory leak
Let's take a look at what HeapRoots tells us in the case of an actual memory leak happening within WebSphere. In this scenario, memory usage sharply and steadily rises when a specific JSP is called. Even after the JSP request returns or is stopped, the memory usage stays at a high level, and is not relieved by garbage collection -- a clear indication of a memory leak.
Trigger a heapdump while memory usage is high, and then use HeapRoots in the interactive mode to diagnose the problem. Let's show objects starting with the roots to an arbitrary depth of 5:
Enter: o[a,s,n,t,d], t[s,c], g[s,c], i, p, d, x or help for more info
> d
Enter threshold [1048576]
E nter max depth or -ve for unlimited [5]
Enter 0x to dump from one address or any value for all roots [NONE]
threshold is 1048576 bytes
max depth is 5 levels
Dumping roots
<0> 0x00565d18 [8,903,424/154,290] class java.lang.System
4 children smaller than 1,048,576 total size/desc: 67,560/293
<1> 0x007c6218 [8,873,032/154,268] com/ibm/ejs/security/SecurityManager
<2> 0x006941d8 [8,873,008/154,267] java.lang.Thread
3 children smaller than 1,048,576 total size/desc: 104/0
<3> 0x007c0a48 [8,872,888/154,265] java/util/HashMap
<4> 0x007c0a08 [8,872,832/154,264] array of java/util/HashMap$Entry
3 children smaller than 1,048,576 total size/desc: 1,256/21
<5> 0x010d7170 [8,871,512/154,239] java/util/HashMap$Entry
1 children smaller than 1,048,576 total size/desc: 40/1
<3> 0x00693fc0 [7,630,200/118,950] com/ibm/ws/bootstrap/ExtClassLoader
14 children smaller than 1,048,576 total size/desc: 1,526,848/30,723
<4> 0x009440b0 [6,112,512/88,215] java/util/Vector
<5> 0x0151f648 [6,112,480/88,214] array of java.lang.Object
3925 children smaller than 1,048,576 total size/desc: 3,679,208/39,002
<3> 0x0069f880 [2,024,640/34,702] java.lang.ThreadGroup
3 children smaller than 1,048,576 total size/desc: 289,088/5,091
<4> 0x00edc638 [1,735,496/29,607] array of java.lang.ThreadGroup
<5> 0x00edc658 [1,735,464/29,606] java.lang.ThreadGroup
2 children smaller than 1,048,576 total size/desc: 14,344/275
<0> 0x016283b0 [514,060,576/1,285] array of [LMemEater;
1285 children smaller than 1,048,576 total size/desc: 514,020,560/0
You can see that there are only two root objects, the System class and an array of an array of something
called MemEater objects. (Don't expect class names to be this descriptive!) The total tree size of the
MemEater array is many times larger than the System class and its descendants. Interestingly, the MemEater
array object has no large (greater than 1 Mbytes) descendants; it appears that the sheer number of its children
accounts for its size.
Let's look at memory another way: what are the largest objects? Let's use the os option to look at the ten
largest objects, not counting their descendants:
Enter: o[a,s,n,t,d], t[s,c], g[s,c], i, p, d, x or help for more info
> os
Enter name to filter on or '-' for no filterting [-]
E
nter combination of types to show, R for Roots, A for Artificial Roots, N for Non-
Roots [R,N,A]
E
nter address range in format 'M','L-U','-U' or 'L-' [0x00000000-0xfffffff8]
Enter range of lines to print in format 'M','L-U','-U' or 'L-' [10-]
-10
Addr. Size Root-Owner Subtree Size Descend. Name
---------------------------------------------------------------------------------
N 0x0295d520 400,016 0x016283b0 400,016 0 array of MemEater
N 0x204b1e00 400,016 0x016283b0 400,016 0 array of MemEater
N 0x029befb0 400,016 0x016283b0 400,016 0 array of MemEater
N 0x0e9a20a0 400,016 0x016283b0 400,016 0 array of MemEater
N 0x0ea03b30 400,016 0x016283b0 400,016 0 array of MemEater
N 0x0f9a7c40 400,016 0x016283b0 400,016 0 array of MemEater
N 0x0fa096d0 400,016 0x016283b0 400,016 0 array of MemEater
N 0x0fe9d590 400,016 0x016283b0 400,016 0 array of MemEater
N 0x2038ce50 400,016 0x016283b0 400,016 0 array of MemEater
N 0x0feff020 400,016 0x016283b0 400,016 0 array of MemEater
(185166 matches but only displayed up to 10.)
Matched objects : 185,166 / 185,166
Total Size : 524,926,312 / 524,926,312
Total Subtree Size : 1,674,611,560
Total Descendants : 10,982,256
So the ten largest single objects are arrays of MemEater objects, and you can see from the address in the Root-Owner column that they do indeed belong to the monster array of arrays you saw earlier.
So now you have a strong hint that an array of arrays of MemEater objects is causing most of your memory to be consumed. Now you have to take the next step, which HeapRoots cannot do for us -- determine what Java code is causing this to happen. In this case, you know that the memory grows steeply when you access a certain JSP file. Looking at the jsp, you see the following code:
<%@ page import="MemEater" %>
<html>
<head><title>Very Simple JSP</title></head>
<body>
<h1>Bad JSP2</h1>
<%
M
emEater.eatMem();
%>
</body>
</html>
If you happen to have the source code for MemEater.java, you can look at the MemEater.eatMem() method:
public class MemEater {
static String leakString=
" .,,; \n" +
" LjLfji \n" +
" E;,itGDt \n" +
" :;tttt... iLDDLjLGiiii \n" +
" tGjGtifLfLLtit; iiDLjiijffGi \n" +
" GjtjiGGDLjjjffGDi iGDfftijfDDii \n" +
" iEEDKEi,ifffjfLLLGtt iiDLftiijLDDi \n" +
" .; .,tffjtfLLDti iDDDt,,;jGDi \n" +
" .;Dt ..:tGGjjjfLDEti DDi,;;i;Gi \n" +
" :L;L;. iDGjjttjDEt KDj,;fj.iK \n" +
" ,L Gt. tEGfttjfDEj KtLGjtjfLK \n" +
" ,jff,. t;fftjj;t ELLfGGLftD \n" +
" ... ttGjtjfGi EWKDEEEDDD \n" +
" tDGftfDEWKi;;ijDi \n" +
" ijtDKWGjtLL;,;,jEiK \n" +
" KDt,,;;jGDj,;;,jEiK \n" +
" tGfjjti;i#Kt,;;iLjKt \n" +
" tELttjjDEDfjLLLGfGEt \n" +
" :L: ttELjtfEfD#WjWt;;tLDt \n" +
" .jGf: ttELftfKKiWt,;,::tGDt \n" +
" ji if ttLLtfWf,;:,:,ifE \n" +
" t;,ij. ttLGGGfjjfjjGt \n" +
" .,t;. ttEGEEt \n";
static MemEater[][] ra;
String member;
public MemEater(String st) {
this.member=new String(leakString);
}
public static void eatMem () {
ra = new MemEater[10000][100000];
for (int i=0; i < = 10000;i++) {
for (int j=0; j < = 100000;j++) {
ra[i][j]=new MemEater(leakString);
}
}
}
}
This is a much simplified version of the kind of code that can cause a memory leak. You can see the method called by the JSP, eatMem, will create a two-dimensional array containing 10000*100000 MemEater objects, each with its own copy of a long string. And the array is a class variable -- it will stay in memory until the MemEater class is garbage-collected, if ever!
Summary of HeapRoots
The HeapRoots tool constructs a snapshot of a JVM's memory space, builds a tree representing the relationship of objects in memory, and gives you various ways of viewing that information to aid you in determining which objects are not being freed. It works on dumps created by the IBM_HEAPDUMP environment variable, which is only recognized by IBM-brand JVMs. Unlike heapdumps created by the standard Hprof-type heapdump, IBM heapdumps store no information about where in Java code objects are being allocated. It is up to you and your application developer to make that connection. The advantage is that it takes very little overhead to enable IBM heapdumps, so it is practical for diagnosing problems in performance-sensitive production environments. A good approach in a production environment would be to try to diagnose a problem using the IBM heapdump approach, and then enable Hprof dumps if you are unable to determine the problem's cause.
Analyzing IBM dumps interactively with HeapWizard
The HeapWizard tool provides a convenient GUI for navigating and interpreting IBM heapdumps. Like Heaproots, HeapWizard is a post-processor application that works upon dumps created by the IBM_HEAPDUMP option of IBM JVMs. It does not work with Hprof heapdumps.
HeapWizard.jar is an executable jar file. To download, go to:
ftp://ftp.software.ibm.com/softwa../WAS51/appserv/support/tools/HeapWizard/HeapWizard.jarTo start HeapWizard, use the following command:
java -Xms128M -Xmx512M -jar HeapWizard.jar
Using HeapWizard
HeapWizard reads IBM heapdump files created using the IBM_HEAPDUMP environment variable. Once the HeapWizard application starts, select File => Open and browse to an IBM heapdump file. Once you have opened the file, you will see a window containing a log of summary information created by HeapWizard as it constructs an object tree.

Close this window and bring focus back to the main HeapWizard pane. Double-click the HeapDump icon to see the Classes by Size and Objects by Size views (see Figure 3). Figure 3: The main panel, tree view
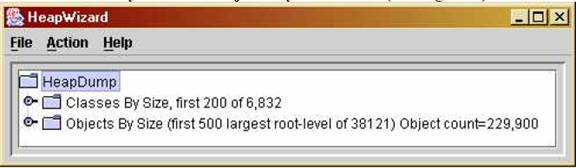
The Classes by Size tree lists the classes whose instances are responsible for occupying most of the memory.
The classes are sorted in descending order by the total size, including descendants, of root objects of that class. In the following example, the class Java.lang.String comprises 44,352 total objects in memory, which along with their children occupy 5,441,832 bytes of memory. Of those 44,352 objects, the total cumulative amount of memory for those String objects that are roots is 2,158,000 bytes.
Some entries begin with class, having count 1. These entries represent memory held by actual class objects themselves, not their instances (see Figure 4).
Figure 4: The classes by size view

As you already observed, in the case of a memory leak, the leak will often be evidenced by a single class whose instances far outnumber the next smaller one.
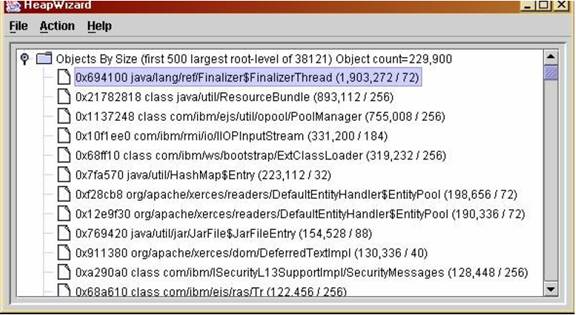
The Objects by Size view lists individual objects in order by the amount of memory, including descendants, that they occupy. In the following example, a single instance of java.lang.ref.Finalizer$FinalizeThread occupies, with its children, 1,903,272 bytes. By itself the object uses a mere 72 bytes (see Figure. 5).
Figure 5: The object tree view
Double-clicking an object in the tree displays a sub-tree of its immediate children, again listed in order by total size. Double-clicking the "fattest" child and grandchild in this tree, for example, produces Figure 6:
Figure 6: Expanding an object in the heap tree

In this example, you can see that the the FinalizerThread object's largest child is an instance of com.ibm.CORBA.iiop.ClientDelegate. Almost all of the ClientDelegate object's memory is in turn held by an attribute of type com.ibm.CORBA.iiop.ORB. Each of these objects is by itself quite small. You could keep on expanding the biggest children until you see a single object that itself is very large, or that is an immediate parent of a large collection of objects.
HeapWizard also provides a command line interface. The readme file contained in the HeapWizard jar file lists the invocation syntax and provides some examples.
An example of heap analysis
So what should you expect to see in the case of an actual leak? Taking the same scenario as in our earlier discussion of the HeapRoots tool, generating an IBM heapdump, and opening it with HeapWizard, you see the Class tree shown in Figure 7.
Figure 7: Class tree

A single root object, the MemEater class, is the parent of the greatest amount of memory by far. This makes sense. Remember that its eatMem() method stores variables in a static attribute -- one that will not be removed unless and until the class itself is removed from memory.
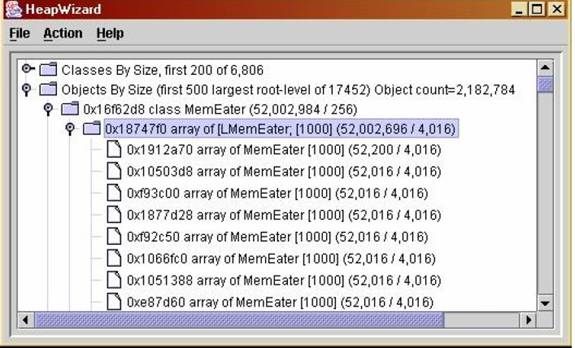
If you look at the Objects tree, you again see that the MemEater class object is the biggest single holder of memory, although by itself it occupies only 256 bytes of memory. If you expand the MemEater class object, you only see two elements: a String object (not shown) occupying a total of 32 bytes, and an array of 1000- element arrays of MemEater instances -- the two-dimensional static array you saw earlier. This two dimensional array occupies about 52 megabytes of memory -- almost all of the memory in our bloated MemEater class! You can see that each of its elements occupies about 53 kilobytes of memory (see Figure 8).
Figure 8: Expanding the largest object in the object by size view
HeapWizard Summary
HeapWizard and HeapRoots are alternative tools for analyzing an IBM heapdump to determine the source of a memory leak. Some users may prefer the interactive GUI provided by HeapWizard. Both tools have the advantage of using as input the lightweight, non-performance-impacting IBM heapdump; both share the disadvantages of not working with standard "Hprof" dumps, and of not associating leaking objects to Java code, since that information is not stored in IBM heapdumps. As with HeapRoots, a reasonable approach would be to try diagnosing a memory leak first by generating an IBM heapdump, then analyze it using HeapWizard. If that is unsuccessful, a next step would be to enable and generate Hprof dumps, and them analyze them manually or with HAT, as described above.
See Also
Finding Java memory leaks in WebSphere Application Server Using Hprof
Diagnose common runtime problems with hprof
The HProf Profiler Agent
IBM developer kits: Diagnosis documentation IBM developerWorks: Java