Tivoli Performance Viewer
Contents
- Features
- Storing data to a log file
- Refreshing data
- Viewing and modifying performance chart data
- Starting TPV
- Set performance monitoring levels
- Viewing summary reports
- Replaying a performance data log file
- Resetting counters to zero
- The Performance Advisor
- Storing data to a log file
See also:
Overview
Tivoli Performance Viewer, which is bundled with WebSphere, is a GUI performance monitor for WAS. TPV can connect to a local or to a remote host.
The Performance Advisor in TPV provides advice to help tune systems for optimal performance and gives recommendations on inefficient settings by using collected PMI data.
One of the things that TPV is NOT good at is telling which class/method is causing the problem. For that you are better off using something like IBM_HEAPDUMP, Performasure, or JProfiler.
Features
TPV is a Java client which retrieves the PMI data from an appserver and displays it in a variety of formats.
You can do the following tasks with the TPV...
- View data in real time
- Record current data in a log, and replay the log later
- View data in chart form, allowing visual comparison of multiple counters. Each counter can be scaled independently to enable meaningful graphs.
- View data in tabular form
- Compare data for single resources to aggregate data across a node
To minimize the performance impact, TPV polls the server with the PMI data at an interval set by the user. All data manipulations are done in the TPV client, which can be run on a separate machine, further reducing the impact. The TPV graphical user interface includes the following...
- Resource selection panel
- Data monitoring panel
- Menu bar
- Toolbar icons
- Node icons
- Status bar
Layout of the console
The performance viewer main window consists of two panels: the Resource Selection panel and the Data Monitoring panel. The Resource Selection panel, located on the left, provides a view of resources for which performance data can be displayed. The Data Monitoring panel, located on the right, displays numeric and statistical data for the resources that are highlighted (selected) in the Resource Selection panel.
You can adjust the width of the Resource Selection and Data Monitoring panels by dragging the split bar left or right. You can rearrange the order of the table columns in the Data Monitoring panel by dragging the column heading left or right. You can also adjust the width of the columns by dragging the edge of the column left or right.
Resource selection panel
The Resource Selection panel provides a hierarchical (tree) view of resources and the types of performance data available for those resources. Use this panel to select which resources to monitor and to start and stop data retrieval for those resources.
The Resource Selection panel displays resources and associated resource categories in an indented tree outline. Clicking the plus (+) and minus (-) symbols expands and collapses the tree to reveal the categories for the various resource instances. The resource tree can also be navigated by using the up and down arrow keys to cycle through the branches and by using the left and right arrow keys to expand and collapse the tree of resources. Resource instances can be expanded to reveal the instances they contain, if applicable. For example, when a EJB JAR instance is expanded, the enterprise bean instances in the EJB JAR are revealed. The Data Monitoring panel automatically displays the appropriate selection of counters for any objects highlighted in the Resource Selection panel.
The first level of the hierarchy includes all nodes (machines) in the administrative domain, followed by all appservers on the node. Below each appserver, all resource categories are listed. If the enterprise beans category is expanded, all EJB JAR instances in the server are displayed. Next, all enterprise bean instances appear below the EJB JAR in the hierarchy. Then, a methods resource is associated with each bean. Clicking an individual bean or EJB JAR instance causes its corresponding counters to be displayed in the Data Monitoring panel. For enterprise beans, the counters displayed depend on whether the bean is an entity bean or a session bean. For EJB JARs, the counters are aggregate counters for all enterprise beans in the EJB JARs.
Data monitoring panel
The Data Monitoring panel enables the selection of multiple counters and displays the resulting performance data for the currently selected resource. It contains two panels: the Viewing Counter panel above and the Counter Selection panel below.
Counter selection panel
The Counter Selection panel shows the counters available for the resource performance category selection.
Two factors determine the list of available counters in the Counter Selection panel...
- Only counters associated with the resource that is selected in the Resource Selection panel are displayed.
- Only counters having impact cost ratings within or below the instrumentation or monitoring level that is set for that resource in the administrative domain are displayed.
The first three counters shown for each resource performance category are selected by default. All counters can be selected or deselected, and the resulting output, shown in the top panel, automatically reflects the selection.
The columns in the Counter Selection panel provide the following information for each counter...
Name The names of the counters that are available for selection with this resource. Description A brief description of the function of each counter. Value The value for the counter, displayed according to the display mode in effect. Values are actual values (not scaled values used for the chart, if applicable). Select A check box that indicates whether a counter is to be reflected in the chart. To hide data, clear the check box. The column representing that counter is then removed from the View Data window, and the graphic display for that counter is removed from the View Chart window. Scale A value indicating whether data has been scaled (amplified or diminished) from its actual value to fit on the chart. This value is reflected only in the View Chart window.
The value for the Scale column can be set manually by editing the value of the Scale field. See Scaling the chart display manually for information on manually setting the scale.
Viewing Counter panel
When a counter on the list in the Counter Selection panel is selected, the statistics gathered from that counter are displayed in the Viewing Counter panel at the top of the Data Monitoring panel.
The View Data window shows the counter's output in table format; the View Chart window displays a graph with time represented on the x-axis and the performance value represented on the y-axis. One or more performance counters can be simultaneously graphed on a single chart. The chart plots data from n data points, where n is the current table size (number of rows).
Display of multiple resources and aggregate data
When a single resource is selected in the Resource Selection panel, the Data Monitoring panel displays a choice of a table view or a chart view. If multiple resources are selected, the Data Monitoring panel displays a single data sheet for viewing summary information for the selected resources. The data sheet displays the tables for all objects of similar type for the selected resources. For example, if three servlet instances are selected, the data sheet displays a table of counter values for all the servlets. By default, the display buffer size is set to 40 rows, corresponding to the values of the last 40 data points retrieved.
The performance viewer provides aggregate data at the module level. If aggregate data is available for a group, it is displayed in the Data Monitoring panel. For example, for each enterprise bean home interface, counters track the number of active enterprise beans of that home. Each EJB JAR has an aggregate value that is the sum of all the enterprise beans in that EJB JAR. The enterprise beans resource category (module) within the appserver has an aggregate value that is the sum of all enterprise beans in all EJB JARs.
Menu bar
The menu bar contains the following options...
File Change to current mode (from logging mode), to open an existing log file, and to exit from the performance viewer. The File menu contains the following items:
Refresh Queries the administrative server for any newly started resources since data retrieval began or for additional counters to report. This operation is also recursive over all components subordinate to the selected resources. TPV refreshes data every 10 seconds. When changing the refresh rate, use an integer greater than or equal to 1. Current Activity Resumes the display of real-time data in tables and charts. This menu option is used to stop viewing data from a log file and return to viewing real-time data. Log Displays a dialog box for specifying the name and location of an existing log file to be replayed. Exit Closes the performance viewer. If you made changes to the instrumentation levels of any resources during the session, a dialog box opens to ask whether you want to save the changed settings before closing the tool.
Logging Provides On and Off options that are used to start and stop recording data in a log file. If you start a new log file and specify the same file name, the file is overwritten. Setting Used to start and stop the reporting of data, and to clear and refresh data. The Setting menu contains the following items:
Clear Buffer Deletes the values currently displayed in tables and charts. For example, after stopping a counter, you can use this operation to remove the remaining data from a table. Reset to Zero Resets cumulative counters of the selected performance group back to zero. View Data As Specifies how counter values are displayed. You can choose whether to display absolute values, changes in values, or rates of change. How data is displayed differs slightly depending on where you are viewing data. The choices follow:
Raw Value Displays the absolute value. If the counter represents load data, such as the average number of connections in a database pool, then the TPV displays the current value followed by the average. For example, 18 (avg:5). Change in Value Displays the change in the current value from the previous value. Rate of Change Displays the ratio change/(T1 - T2), where change is the change in the current value from the previous value, T1 is the time when the current value was retrieved and T2 is the time when the previous value was retrieved.
Log Replay Includes Rewind Stop Play Fast Forward . Note that right-clicking a resource in the Resource Selection panel displays a menu that provides the following options: Refresh, Clear Buffer, and Reset to Zero.
Help Provides information for users.
Toolbar icons
Toolbar icons provide shortcuts to frequently used commands. The toolbar includes the following icons...
Refresh Updates data and structures for the selected resources. That is, it polls the administrative server to retrieve new information about additional counters to display or new servers recently added to the domain. Clear Buffer Deletes the values currently displayed in all tables and charts. Reset to Zero Resets the counters.
Node icons
In the Resource Selection panel, the color of the node icon indicates the current state and availability of the appserver in the domain.
Green The resource is running and available. Red The resource is stopped.
Status bar
The status bar across the bottom of the performance viewer window dynamically displays the current state of the reporting values. The following state information is reported in the status bar...
- The current setting for the refresh rate
- The buffer size in use in the current Viewing Counter panel
- The display mode in use in the current Viewing Counter panel
- The current state of the logging setting
Storing data to a log file
You can save all data reported by the to a log file, in either binary (serialized Java objects) or XML format.To start recording data, click on Logging.
Specify the name, location, and format type of the log file in the Save dialog box. The Files of type field allows an extension of *.perf for binary files or *.xml for XML format.
Note that *.perf files may not be compatible between fix levels.
Refreshing data
The refresh operation is a local, not global, operation that applies only to selected resources. The refresh operation is recursive; all subordinate or children resources refresh when a selected resource refreshes. To refresh data...- Click one or more resources in the Resource Selection panel.
- Click File | Refresh.
Alternatively, click the Refresh icon or right-click the resource and select Refresh.
Clicking refresh with server selected under the viewer icon causes TPV to query the server for new PMI and product configuration information. Clicking refresh with server selected under the advisor icon causes TPV to refresh the advice provided, but will not refresh PMI or product configuration information.
Viewing and modifying performance chart data
The View Chart tab displays a graph with time as the x-axis and the performance value as the y-axis.
- Click a resource in the Resource Selection panel.
The Resource Selection panel, located on the left side, provides a hierarchical (tree) view of resources and the types of performance data available for those resources. Use this panel to select which resources to monitor and to start and stop data retrieval for those resources.
- Click the View Chart tab in the Data Monitoring panel.
The Data Monitoring panel, located on the right side, enables the selection of multiple counters and displays the resulting performance data for the currently selected resource. It contains two panels: the Viewing Counter panel above and the Counter Selection panel below. If necessary, you can set the scaling factors by typing directly in the scale field.
Scale the performance data chart display
You can manually adjust the scale for each counter so that the graph allows meaningful comparisons of different counters. Follow these steps to manually adjust the scale...- Double-click the Scale column for the counter that you want to modify.
- Type the desired value in the field for the Scale value.
The View Chart display immediately reflects the change in the scaling factor.
The possible values for the Scale field range from 0 to 100 and show the following relationships...
- A value equal to 1 indicates that the value is the actual value.
- A value greater than 1 indicates that the variable value is amplified by the factor shown. For example, a scale setting of 1.5 means that the variable is graphed as one and one-half times its actual value.
- A value less than 1 indicates that the variable value is decreased by the factor shown. For example, a scale setting of .5 means that the variable is graphed as one-half its actual value.
Scaling only applies to the graphed values.
Starting TPV
You can start TPV from the commandline...
tperfviewer.sh host_name port_number connector_type
For example...
tperfviewer.sh localhost 8879 SOAP
connector_type can be either SOAP or RMI. To discover what port connect Tivoli to:
Servers | Application Servers | server_name | End Points
If you are connecting to WAS, use the appserver host and connector port. If additional servers have been created, then use the appropriate server port for which data is required. will only display data from one server at a time when connecting to WAS.
If you are connecting to WAS Network Deployment, use the deployment manager host and connector port. TPV will display data from all the servers in the cell. TPV cannot connect to an individual server in WAS Network Deployment.
8879 Default SOAP connector port for WAS Network Deployment. 8880 Default SOAP connector port for WAS. 9809 Default RMI connector port for WAS Network Deployment. 2809 Default RMI connector port for WAS.
You can also start the TPV from Windows using:
Start | Programs | IBM WebSphere | Application Server v.50 |
You can adjust the data collection settings.
Running with security enabled
In order to run a PMI client application with security enabled, have $CLIENTSOAP and $CLIENTSAS properties on your JVM command line. These properties are defined in the setupCmdline.sh file.
- Set com.ibm.SOAP.securityEnabled to True in...
WAS_ROOT/properties/soap.client.props
- Set com.ibm.SOAP.loginUserid and com.ibm.SOAP.loginPassword as the user ID and password for login.
You need to alter this part:
#------------------------------------------------------------------------------
# SOAP Client Security Enablement
#
# - security enabled status  ( false[default], true  )
#------------------------------------------------------------------------------
com.ibm.SOAP.securityEnabled=false

# JMX SOAP connector identity
com.ibm.SOAP.loginUserid=
com.ibm.SOAP.loginPassword=
For example:
com.ibm.SOAP.securityEnabled=true
com.ibm.SOAP.loginUserid=login
com.ibm.SOAP.loginPassword=password
A common mistake is leaving extra spaces at the end of the lines in the property file. Do not leave extra spaces at the end of the lines, especially for the user ID and password lines.
Set performance monitoring levels
The monitoring settings determine which counters are enabled. Changes made to the settings from affect all applications that use the PMI. To view monitoring settings...
File | Current Activity

Set monitoring levels by choosing one of the following options...
None: Provides no data collection Standard: Enables data collection for all modules with monitoring level set to high Custom: Allows customized settings for each module
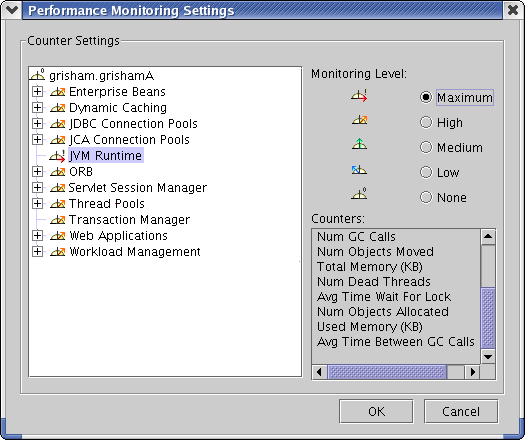
These options apply to an entire appserver.
Click Specify to set the monitoring level to custom.
For each resource, choose a monitoring level of None, Low, Medium, High or Maximum. The dial icon will change to represent this level. Note: The instrumentation level is set recursively to all elements below the selected resource. You can override this by setting the levels for children AFTER setting their parents.
If the instrumentation level excludes a counter, that counter does not appear in the tables and charts of the performance viewer. For example, when the instrumentation level is set to low, the thread pool size is not displayed because that counter requires a level of high.
Viewing summary reports
Summary reports are available for each appserver. Before viewing reports, make sure data counters are enabled and monitoring levels are set properly.The standard monitoring level will enable all reports except the report on EJB methods. To enable EJB methods report, use the custom monitoring setting and set the monitoring level to Max for the Enterprise Beans module. To view the summary reports...
- Click the appserver icon in the navigation tree.
- Click the appropriate column header to sort the columns in the report.
Replaying a performance data log file
You can replay both binary and XML logs by using the Tivoli Performance Viewer. To replay a log file, do the following...- Click Data Collection in the navigation tree.
- Click the Log radio button in the Performance data from field.
- Click Browse to locate the file that you want to replay or type the file path name in the Log field.
- Click Apply.
- Play the log by using the Play icon or click Setting > Log Replay > Play.
By default, the data replays at the same rate it was collected or written to the log. You can choose Fast Forward mode in which the log replays without simulating the refresh interval. To Fast Forward, use the button in the tool bar or click Setting > Log Replay > FF.
To rewind a log file, click Setting > Log Replay > Rewind or use the Rewind icon in the toolbar.
While replaying the log, you can choose different groups to view by selecting them in the Resource Selection pane. You can also view the data in either of the views available in the tabbed Data Monitoring panel.
You can stop and resume the log
at any point. However, you cannot replay data in reverse.
Clearing values from tables and charts
Selecting Clear Values removes remaining data from a table or chart. You can then begin populating the table or chart with new data. To clear the values currently displayed...- Click one or more resources in the Resource Selection panel.
- Click Setting > Clear Buffer. Alternatively, right-click the resource and select Clear Buffer
Resetting counters to zero
Some counters report relative values based on how much the value has changed since the counter was enabled. The Reset to Zero operation resets those counters so that they will report changes in values since the reset operation. This operation will also clear the buffer for the selected resources. See "Clearing values from tables and charts" in Related Links for more information about clearing the buffer for selected resources. Counters based on absolute values can not be reset and will not be affected by the Reset to Zero operation.To reset the start time for calculating relative counters...
- Click one or more resources in the Resource Selection panel.
- Click Setting > Reset to Zero. Alternatively, right-click the resource and click Reset to Zero.
The Performance Advisor
The Performance Advisor in Tivoli Performance Viewer provides advice to help tune systems for optimal performance and gives recommendations on inefficient settings by using collected PMI data. Advice is obtained by selecting the Performance Advisor icon in TPV. To get advice:
- Enable PMI services in your appservers and node agents
- Start the .
- Enable data collection using the TPV or the command line.
- Simulate a production level load.
- Store data to a log file.
- Replay performance data log file.
- Refresh data.
- Choose the Advisor icon.
- If the Refresh Rate is adjusted, the Buffer Size should also be adjusted to allow sufficient data to be collected for performing average calculations. Currently 2 minutes of data is required.
- Update the product configuration for improved performance, based on advice.
Since refreshes advice at a single instant in time, take the advice from the peak load time.Although the performance advisors attempt to distinguish between loaded and idle conditions, misleading advice might be issued if the advisor is enabled while the system is ramping up or down. This result is especially likely when running short tests. Although the advice helps in most configurations, there might be situations where the advice hinders performance. Due to these conditions, advice is not guaranteed. Therefore, test the environment with the updated configuration to ensure it functions and performs well.
Over a period of time the advisor may issue differing advice. This is due to load fluctuations and runtime state. When differing advice is received the user should look at all advice and the time period over which it was issued. Advice should be taken during the time that most closely represents peak production load.
Performance tuning is an iterative process. After applying advice, simulate a production load, update the configuration based on the advice, and retest for improved performance. This procedure should be continued until optimal performance is achieved.
- Clear values from tables and charts.
- Reset counters to zero.
See Also
Run monitoring applications with security enabledPerformance monitoring service settings
Performance Advisor Report in
Performance data refresh behavior
Change the refresh rate of data retrieval
Change the display buffer size
Performance data organization
Storing data to a log file