Accessing Dashboard application
We can access the Dashboard web application from either your browser or from the Configuration Editor.
Before you begin
Start Security Directory Integrator Server before accessing the Dashboard.Parent topic:
SDI DashboardOpening from a browser
Procedure
From a browser, go to https://<host name>:<rest-api-port>/dashboard. The Dashboard home page is displayed.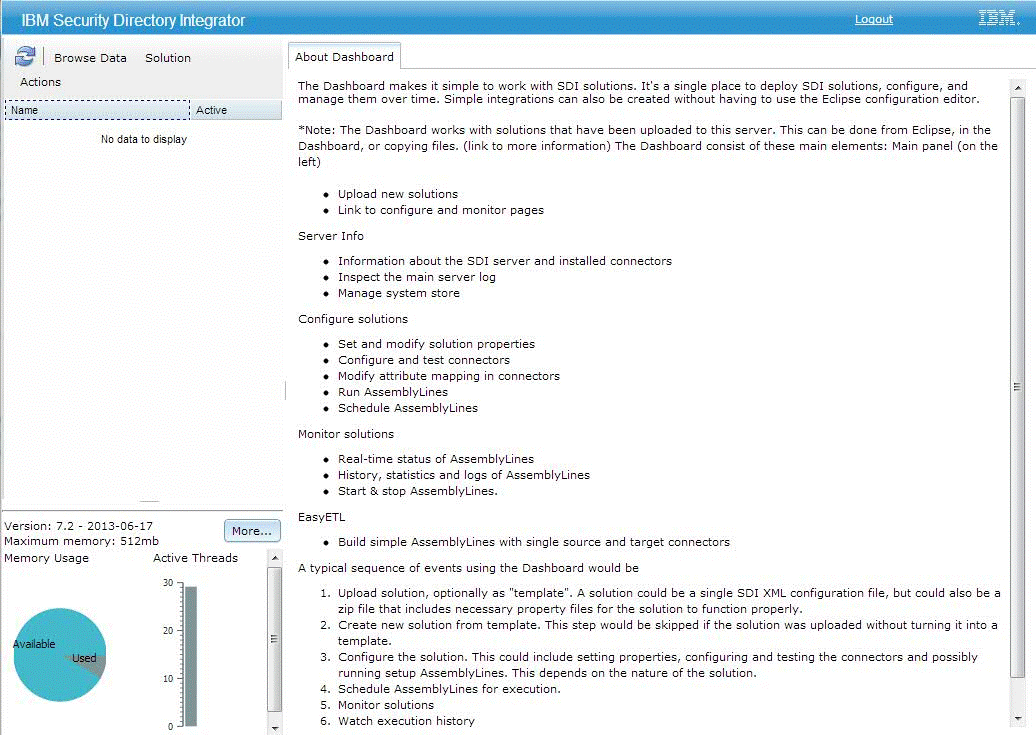 Note: By default,
we can access Dashboard on the local host. To authenticate a user,
set the SDI properties file to add
LDAP user name and password for both remote and local access.
Note: By default,
we can access Dashboard on the local host. To authenticate a user,
set the SDI properties file to add
LDAP user name and password for both remote and local access.
Opening from the Windows Start menu
Procedure
From the Windows Start menu, choose Start > All Programs > SDI v7.2 > Open Dashboard. The SDI Dashboard home page is displayed.| Menu Option | Description | |
|---|---|---|
| Browse Data | Use this option to configure the selected connector and browse its contents. | |
| Solution | Monitor | Use this option to track the progress of AssemblyLine execution and view the execution history of the solution. |
| Start | Use this option to start the selected solution. | |
| Stop | Use this option to terminate a running solution. | |
| Configure | Use this option to open the selected solution for modification. | |
| Delete | Use this option to delete the selected solution from the server. | |
| Unlock Solution | Use this option to unlock a solution. | |
| Actions | Browse Data | Use this option to configure the selected connector and browse it contents. |
| Show System Log | Use this option to view the contents of system log (ibmdi.log). | |
| Create Solution | Use this option to choose a template and create a data integration solution. | |
| Upload Solution | Use this option to upload an existing solution to the SDI Server. | |
| Show Server Details | Use this option to view information about SDI such as version, installed components, and other server information. | |