Binary logging
Binary logging is a high performance log and trace facility based on the full profile High Performance Extensible Logging (HPEL) technology.
We must enable the binary logging facility to use it.
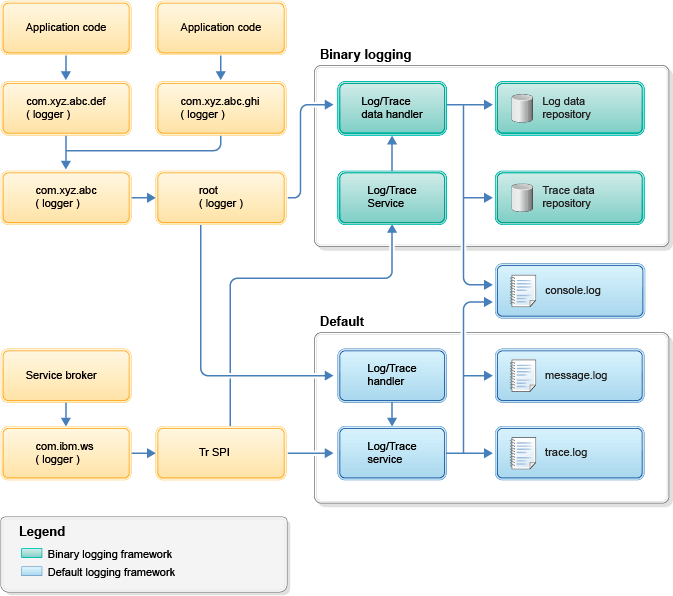
Binary logging provides a convenient mechanism for storing and accessing log, trace, System.err, and System.out information produced by the application server or the applications. It is an alternative to the default log and trace facility, which provides the JVM logs and diagnostic trace files commonly named messages.log and trace.log.
Log and trace storage
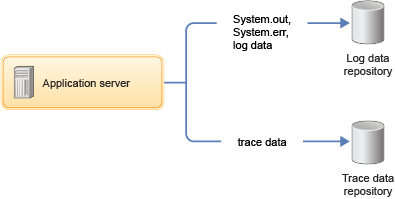
Binary logging provides a log data repository and a trace data repository. See the following figure to understand how applications and the application server store log and trace information.

- Log data repository
-
The log data repository is a storage facility for log records. Log data is typically intended to be reviewed by administrators. This includes any information applications or the server write to System.out, System.err, OSGi logging service at level LOG_INFO or higher (including LOG_INFO, LOG_WARNING, and LOG_ERROR), or java.util.logging at level Detail or higher (including Detail, Config, Info, Audit, Warning, Severe, Fatal, and any custom levels at level Detail or higher).
- Trace data repository
-
The trace data repository is a storage facility for trace records. Trace data is typically intended for use by application programmers or by the WebSphere Application Server support team. This includes any information applications or the server write to the OSGi logging service at level LOG_DEBUG or java.util.logging at levels below level Detail (including Fine, Finer, Finest, and any custom levels below level Detail).
Log and trace performance
Binary logging has been designed and tested to significantly outperform the default log and trace facility. One result is that the application server can run with trace enabled while causing less impact to performance than tracing the same components using the default log and trace framework. Another result is that applications that frequently write to the logs can run faster when using binary logging.
- Log and trace events are each stored in only one place
-
Log events, System.out, and System.err are stored in the log data repository. Trace events are stored in the trace data repository. Storing each type of event in only one place ensures that performance is not wasted on redundant data storage.
The console log should be disabled in cases where logging performance is important. Any content written to the console log will already be stored in the log data repository.

- Data is not formatted unless it is needed
-
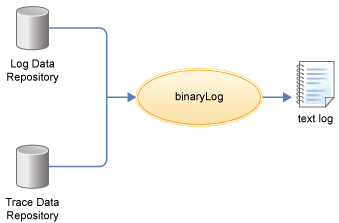
Formatting data for a user to read uses processor time. Rather than format log event and trace event data at run time, log and trace data are stored more rapidly in a proprietary binary representation. This improves the performance of the log and trace facility. By deferring log and trace formatting until the binaryLog command is run, sections of the log or trace that are never viewed are never formatted.
- Log and trace data are buffered before being written to disk
-
Writing large blocks of data to a disk is more efficient than writing the same amount of data in small blocks. The binary logging facility provides the capability to buffer log and trace data before writing it to disk. By default, log and trace data are stored in an 8 KB buffer before being written to disk. If the buffer is filled within 10 seconds, the buffer is written to disk. If the buffer is not filled within that time it is automatically written to disk to ensure that the logs have the most current information.
Administration of log and trace
Administrators can configure how much disk space to dedicate to logs or trace, or how long to retain log and trace records, and leave the management of log and trace content up to the server. As another example all log, trace, System.out, and System.err content can be accessed using the binaryLog command, avoiding any possible confusion over which file to access for certain content.
- Reading from the log data and trace data repositories
-
The log data and trace data repositories are stored in a WebSphere Application Server proprietary format and cannot be read using text file editors such as Notepad or VI. We can copy the log data and trace data repositories in to a plain text format using the binaryLog command.

- binaryLog command
-
The binaryLog command-line tool works with log data and trace data repositories, providing filtering and formatting options. For example, a user might filter any errors or warnings, then filter all log and trace entries that occurred within 10 seconds of a key error message on the same thread.
- Filtering using log and trace record extension content
-
The binary logging facility provides the capability for developers to add custom extensions to log and trace records using a log record context API (com.ibm.websphere.logging.hpel.LogRecordContext). We can use the binaryLog command-line tool to filter records based on the content of log and trace record extensions.
Development resources
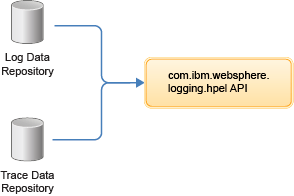
Log and trace content can be filtered to show only the records that are of interest. We can use the binaryLog command line tool or developers can create log handling programs using the HPEL API.

- Reading the log data and trace data
-
An API has been provided to make it easy for developers to develop tools to consume content from the binary log and trace repositories. For example, a developer might write a Java program to search the log and trace content to find any messages with message IDs that match a known list of important message IDs. This API is in the com.ibm.websphere.logging.hpel package. Refer to the API documentation for details on the HPEL log reading API.
- Log and trace record extensibility
-
Developers can add custom extensions to log and trace records through a log record context API (com.ibm.websphere.logging.hpel.LogRecordContext). When binary logging stores log and trace records, it includes any extensions present in the log record context on the same thread. For example, a developer might write a servlet filter to add important HTTP request parameters to the log record context. While that servlet runs, HPEL API adds those extensions to any log and trace records created on the same thread.
As with other log and trace record fields, developers can access the record extensions using the HPEL API. This is useful when writing tools to read from log and trace repositories. Developers can also make use of the log record context API to access extensions in custom log handlers, filters, and formatters at run time.
Subtopics
Parent topic: WebSphere Application Server Liberty Core: Overview
Parent topic: Troubleshooting tips