IBM BPM, V8.0.1, All platforms > Authoring services in Integration Designer > Testing modules > Unit testing > Integration test client
Configurations page of the integration test client
In the Configurations page of the integration test client, you can edit the default test configuration or you can create and edit new test configurations. You can add modules to your test configurations, or add emulators and monitors to your test configuration modules, to more precisely control your tests.
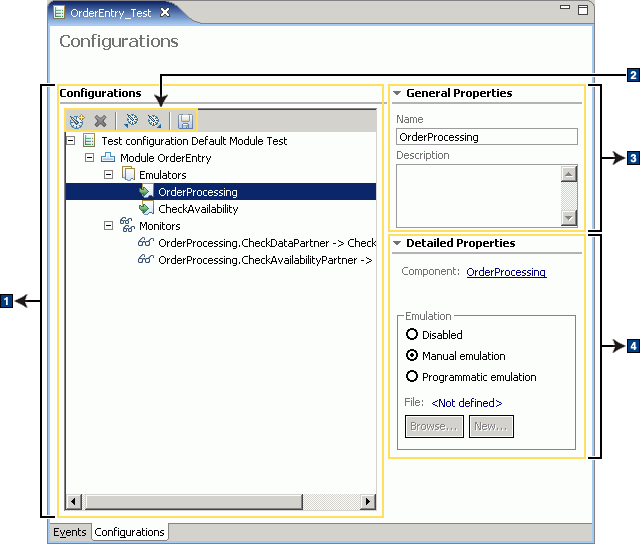
The Configurations page is shown in the following figure:

As shown in the figure, there are four major areas of the Configurations page. These areas are described in the following sections:
Configurations area
The Configurations area provides a tree view of your test configurations and test bucket configurations.
For any given test configuration, the following information is shown:
- The name of the test configuration.
- The name and version of the process application or toolkit.
- The names of the modules in the test configuration.
- The names of any emulators in each test configuration module.
- The names of any monitors in each test configuration module.
For any given test bucket configuration, one or more of the following is shown:
- The name of the test bucket configuration.
- The name of the test suite in the test bucket configuration.
- The names of the test cases in the test suite.
- The name of the test configuration in the test suite.
- The name and version of the process application or toolkit.
- The names of the modules in the test configuration.
- The names of any emulators in each test configuration module.
- The names of any monitors in each test configuration module.
In the Configurations area, emulators for references have the following naming convention:
ComponentName. referenceName
By comparison, emulators for components have the following naming convention:
ComponentName
And monitors have the following naming convention:
SourceComponentName.referenceName - ComponentName
Control area
You can use the following icons in the control area to manage your test configurations:
| Icon | Description |
|---|---|
| Add | Opens the New Configuration wizard, with which you can add one of the following test configuration elements to the Configurations page:
|
| Remove | Removes selected test configuration elements from the Configurations page. |
| Save Configuration | Opens the Save Configuration window, where you can save test configurations to a test configuration file. |
| Load Configuration | Opens the Load Configuration window, which you can use to load saved test configurations from a test configurations file. |
| Save Test Client | Opens the Save Test Trace window, with which you can save the test trace. |
General Properties
The General Properties area provides the name and description (if any) of any test configuration element selected in the Configurations area.
Detailed Properties
The Detailed Properties area displays the specific properties of any test configuration element that is selected in the Configurations area.
For example, if a test configuration is selected in the Configurations area, the Detailed Properties area displays the name of any modules contained in the test configuration, as shown in the following figure:

The Detailed Properties area also contains a User ID display field and a Logout button.
If security is enabled for your test client server and you have logged in using a user ID, the User ID field displays the user ID for the test configuration that is selected in the Configurations area. You can use the Logout button to manually log out of the login session.
If a module is selected in the Configurations area, the Detailed Properties area displays information about the deployment location of the module, as shown in the following figure:

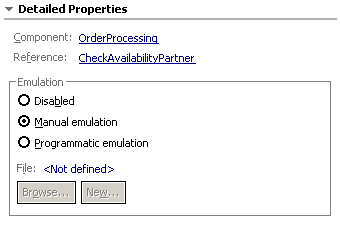
If an emulator is selected in the Configurations area, the Detailed Properties area displays the hyperlinked name of the component or reference that is being emulated. You can click this link to open the component or reference in the assembly editor. The Detailed Properties area also shows whether the emulator uses manual emulation, or programmatic emulation, or is disabled. You can redefine a manual emulator as a programmatic emulator, or you can redefine a programmatic emulator as a manual emulator. The Detailed Properties area for a selected emulator is shown in the following figure:

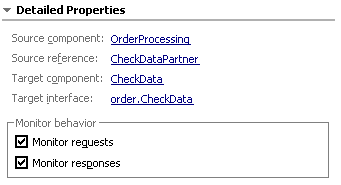
If a monitor is selected in the Configurations area, the Detailed Properties area displays information about the wire that is being monitored, such as the hyperlinked names of the source component and reference and the target component and interface.
You can click any of the links to open the component, reference, interface in the assembly editor. The Detailed Properties area also shows whether the wire is being monitored for requests, responses, or both, which you can change if necessary. The Detailed Properties area for a selected monitor is shown in the following figure:
