Participating in processes
Process Portal is the user interface that is available with all editions of IBM Business Process Manager for participating in processes. In addition, IBM Business Process Manager Advanced provides a set of widgets that you can use to participate in processes.
If your system is configured for IBM Connections or an appropriate version of Domino server, you can also claim and complete tasks directly from notifications that you receive in these applications.
Getting started with Process Portal
Use Process Portal to work on your assigned tasks and collaborate with others to complete your work efficiently. In addition, if you have the associated permission, you can use dashboards to view and act on the performance of individuals, teams, and processes.
Use a web browser to access Process Portal. The web address has the following format:
- http://[host_name]:[port]/portal
Provide the name of the host on which IBM Process Center Server or Process Server is installed and the port that was designated for the server during IBM Business Process Manager installation.
The following figure shows the main areas of the default Process Portal interface.
Figure 1. Main areas of the default Process Portal interface
The following table describes each of the numbered areas in the preceding figure.
| Area | Description |
|---|---|
| 1 | The start page icon. Your designated start page is shown whenever you log in to Process Portal. You can bookmark a different page, including a search results page or a dashboard page, to be your start page. |
| 2 | The Work page. This page contains both the tasks that you have claimed to work on and the tasks that are available for you to claim. |
| 3 | The Team Performance dashboard. Use this dashboard
to monitor the performance of your teams and their members, and to balance workload across members of a team.
You must be a member of a team of managers to access this dashboard. |
| 4 | The Process Performance dashboard. Use this dashboard to monitor the performance of processes, and the progress of individual process instances.
You must be a process owner to access this dashboard. |
| 5 | The organize tabs icon. Click the icon to display a list of all the dashboards and saved searches that are available to you. Drag pages in the list to reorder the tabs and to designate
which pages are visible.
Reordering the pages is not supported for Safari on iPad. |
| 6 | Links to your user preferences page and Logout. Click your name to work with your user preferences, for example, to update your business card information, or to change your notification preferences. |
| 7 | The tabbed area. The tabs that are shown here depend on the Process Portal page that you are using. When the Work page is displayed, this area contains the following tabs:
|
| 8 | The other spaces icon. This icon is available only for Process Portal on IBM Business Process Manager Advanced. Click the icon to navigate to other Process Portal spaces. |
| 9 | The copy link icon. Use this link to refer to the current Process Portal page in documents and emails, or to directly access the page in a browser window. |
- Set preferences in Process Portal Your user profile contains your personal contact information, and preferences that you can set for working with Process Portal, and receiving notifications.
- Dashboards in Process Portal A dashboard uses charts and graphs to help you visualize status data for one or more business processes. To analyze and manage the work on your business processes, you can use the ready-to-use dashboards that Process Portal includes or the company-specific dashboards the installation might provide.
- Process Portal, and Internet Explorer V8 Process Portal works differently on Internet Explorer V8 than on other browsers and newer versions of Internet Explorer.
- Accessibility in Process Portal Accessibility features and keyboard navigation help users who have a disability, such as restricted mobility or limited vision, to use information technology products successfully.
- Process Portal: What's new in BPM V8.5 The Process Portal that is available in V8.5 of BPM includes updates to the appearance and functionality from the Process Portal in BPM V8.0.
Set preferences in Process Portal
Your user profile contains your personal contact information, and preferences that you can set for working with Process Portal, and receiving notifications.
You can change the following settings in your user profile:
- Contact information, including a photo. Your photo appears in your posts and comments.
- Portal preferences. These preferences include settings for your working language, receiving confirmation messages when you claim a task or unfollow a process, and receiving notifications by email or an IBM Connections notification.
- Notification preferences. By default, you receive a notification when an event occurs that affects you, for example, a task is assigned to you, or you are mentioned in a post.
- Click your name in the Process Portal header, and select User Profile.
- Make the changes to your settings and click Update to save them.
Your changes take effect immediately except for changes to the language setting. If you change your language setting, log out and log in to Process Portal for your changes to take effect.
If you select Arabic or Hebrew as your language setting, you have only limited search capabilities in the Team Performance and Process Performance dashboards.
Related tasks:
Enable email for Process Portal notifications
Enable IBM Connections integration
Dashboards in Process Portal
A dashboard uses charts and graphs to help you visualize status data for one or more business processes. To analyze and manage the work on your business processes, you can use the ready-to-use dashboards that Process Portal includes or the company-specific dashboards the installation might provide.
The following ready-to-use dashboards are included in Process Portal, and available to you if you have the appropriate authorization.
Restriction: You cannot view the dashboards with Internet Explorer 8.
| Dashboard | Usage | Required authorization |
|---|---|---|
| Team Performance | Shows the status of the tasks for teams for which you are the designated team manager. You can manage the work load for the team and individual.
For more information about this dashboard, see Manage work for teams. |
|
| Process Performance | Shows the status of the active instances of particular processes in your organization. You can act on individual process instances to resolve issues, such as bottlenecks.
For more information about this dashboard, see Manage processes and process instances. |
Other users can view the process instance that is associated with the task they are working on. |
An administrator might also have enabled the following dashboards in the Process Portal environment.
Some of these dashboards are deprecated in BPM V8.5.
| Dashboard | Usage | Required authorization |
|---|---|---|
| My Performance | Shows the status of your tasks for either a specific group or all the groups that you are a member of. You can also choose a specific business process to analyze or view data for all the processes that you participate in.
This dashboard includes the following data:
|
|
| My SLA Overview | If service level agreements (SLAs) are defined and exposed, this dashboard displays a table listing the name, description, and status of the SLAs. To display a trend chart that shows the violations for selected SLAs, you select one or more of the SLAs. | To see the dashboard, you must be a member of the team the equivalent scoreboard is exposed to. |
| Deprecated: My Team Performance | Shows the status of the tasks assigned to the groups for which you are the designated manager in the Process Admin console.
The dashboard includes the following data:
|
|
| Deprecated: Process Performance dashboard that is based on the Process Performance scoreboard | Shows the status of the active instances of particular processes in your organization.
The dashboard includes the following data:
|
|
Related tasks:
Exposing Business Process Definitions
Exposing performance scoreboards
Enable process instance management for a BPD
Process Portal, and Internet Explorer V8
Process Portal works differently on Internet Explorer V8 than on other browsers and newer versions of Internet Explorer.
Process Performance and Team Performance dashboards
Neither of these dashboards is supported on Internet Explorer V8.
Process instance view
To see information about a process instance, click the instance name, or click the down arrow to the right of a task name, and select View Instance. You see the process instance view on the BPM V8 version of the page.
When you use a browser other than Internet Explorer V8, you see the process instance view on the Process Performance dashboard.
Projected path management
If you are a process owner, you can manage the projected path of a process instance. In the process instance view, click the down arrow to the right of the instance name, and select Projected Path Management. From the Batch Modify window, you can perform the following actions:
- Change the due date of a process instance.
- Adjust the priorities and due dates of individual activities and tasks.
- Adjust the priorities and due dates of several activities and tasks at one time.
When you use a browser other than Internet Explorer V8, you can manage the projected path from the Process Performance dashboard for a process instance.
Accessibility in Process Portal
Accessibility features and keyboard navigation help users who have a disability, such as restricted mobility or limited vision, to use information technology products successfully.
Accessibility features
The following list includes the major accessibility features in Process Portal, and Process Portal spaces.
- Keyboard-only operation
- Interfaces that are commonly used by screen readers
- Information is communicated independently of color
- Documentation is in an accessible format
- Interfaces can be accessed without inducing seizures due to photosensitivity
Keyboard navigation
Process Portal, and Process Portal spaces use standard Microsoft Windows navigation keys. For a list of standard keyboard shortcuts in Microsoft Windows, see the Keyboard Assistance information from Microsoft at http://www.microsoft.com/enable/products/keyboard.aspx.
The following list identifies keyboard navigation techniques that are specific to Process Portal:
- Stream tab
- To navigate away from the Stream tab, press Esc.
- Details, Stream, and Experts tab
- To access the Connections business card for a user on any of these tabs, press Tab until you get to the user you are interested in, and then Ctrl+Enter twice.
- Organize tabs list
- The following table summarizes the keyboard navigation techniques
for the Organize tabs list where Process Portal users change order of tabs, and designate dashboards and saved searches
as either displayed or hidden tabs. For drag and drop to work when the JAWS screen reader is running, turn off the virtual PC cursor
mode by pressing Insert + Z. However, for JAWS to read the snapshot names in the organize tabs list, you must turn on the virtual PC cursor
mode by pressing Insert + Z.
Keyboard navigation in the Organize tabs list
Action Key Change the focus to the item to move. Press Tab or Shift+Tab. Select an item in the list. Press the spacebar. Move the item to a new location in the list. Press the up and down arrow keys. Set the item to its new location in the list. Press the spacebar. Set the item to its new location, select it, close the list, and show the item in a tab. Press Enter. Cancel the operation and leave the item where it was originally. Press Esc or Tab. - Diagram view
- The diagram supports both tree-style navigation and graph-style
navigation using the tab key. You can switch between the two types of navigation. Graph traversal is controlled by the order in which the diagram is constructed.
Keyboard navigation in the Diagram view
Action Key Navigate to the first swimlane. Press Tab, and then the Down Arrow key. Toggle between the tree-style navigation and the graph-style navigation that uses links. Press F8. Clear the focus and all elements in the current selection. Press Esc. Navigate the diagram. Use the arrow keys to traverse the diagram in accordance with the selected navigation style. For more information on the use of the arrow keys, refer to the table for the corresponding navigation style in Change current focus from the keyboard.
Zoom in the diagram. Press Tab until you get to the slider, and then use the Left and Right Arrow keys to zoom in and out. Toggle between a subprocess activity and its parent process. Press Enter to open the subprocess activity. To return to the parent process, press Esc. This action closes the diagram view, and then you can reopen it.
Navigate the diagram for a subprocess activity. Press F8 twice to turn on tree-style navigation. Use the arrow keys to traverse the nodes in the diagram. Press F8 again, to switch to graph-style navigation. Use the arrow keys to traverse the nodes and links in the diagram.
For more information on the use of the arrow keys, refer to the table for the corresponding navigation style in
Change current focus from the keyboard.
Navigate away from the Diagram view. Press Esc. Print the diagram. Press Tab until you get to the Print Diagram button, and then press Enter to open the Print window. - Date selection in the Modify Task window, Change Process Due Date window, and Ad Hoc Reports page
-
Keyboard support for date selection
Action Key Navigate between date cells Left, Right, Up, and Down arrows Navigate to the same day in the next month Page Down Navigate to the same day in the previous month Page Up Navigate to the same day in the next year Ctrl+Page Down Navigate to the same day in the previous year Ctrl+Page Up Navigate to the first day in the month Home Navigate to the last day in the month End Select the date Enter -
 Process Portal spaces
 -
- When the borders for a widget are hidden, the widget menu and minimize and maximize controls are unavailable. To show the borders to access these controls, press Tab until the widget has focus and then press Enter. This action is the equivalent of hovering over the widget with the mouse and then clicking the Show title bar link.
- When you create or edit a space, you can skip to the Save button by using an accelerator. For Mozilla Firefox, use Shift+Alt+X. For Microsoft Internet Explorer, use Alt+X.
Interface information
The following list contains interface information that is specific to Process Portal:
- Customizing display attributes: Process Portal: relies on cascading style sheets to render the user interface correctly. However, the application provides equivalent facilitation for low-vision users by using your system display settings, including high-contrast mode. You can also increase the size of Process Portal pages by using your browser zoom feature.
- Navigating to the sidebar: A WAI-ARIA main landmark is provided to enable screen reader users to go directly to the sidebar panel that contains the Launch, Following, and Mentions tabs.
- Zooming activity details in a diagram view in Mozilla Firefox:
Navigate to the activity. When the activity details appear, click the window, and then Ctrl+plus sign key (+) to zoom in and Ctrl+minus
sign key (-) to zoom out of the diagram.
- Use JAWS with forms controls: Generally, JAWS automatically changes from the virtual PC cursor mode to forms mode when it encounters forms controls, such as input tags. If a control does not respond to the keyboard, press Insert+Z to turn off the virtual PC cursor
mode.
- Use dashboards: The following ready-to-use dashboards provided with Process Portal, and any company-specific dashboards, are not fully accessible:
- My Performance
- My Team Performance
- Process Performance
- SLA Overview
These dashboards can be zoomed up to 200 percent, and they are visible in high-contrast mode. However, these dashboards have only partial keyboard and minimum contrast support, and the graphical charts have no text alternatives.
The histogram on the Team Tasks page of the Team Performance dashboard is not fully accessible, however, there are accessible alternative methods for accomplishing similar tasks. For example, to filter tasks by day in the histogram, the alternative accessible method is to enter a search filter or sort the list by category and then scroll to the grouped information.
The
following list contains special instructions for using the JAWS screen reader with Process Portal spaces and the widgets they contain:
- If a widget has focus and JAWS does not say the widget name, press Insert+Z to turn off the virtual PC cursor. JAWS then says the widget name. JAWS also says the controls on the widget border when use the Tab key to navigate through them.
- To make JAWS read the contents of the in-focus widget, press Insert+Down Arrow (Say All).
- In the Create Space window, navigate between the radio buttons by pressing the Up or Down Arrow keys twice. If you press the Arrow key only once, the drop-down list associated with the radio button item gets focus. This behavior differs from the standard Windows behavior where pressing the Arrow key once puts the focus on the other radio button. You can also put focus on the drop-down list by pressing Tab.
- In the Create Space window, if you use F4 to open a drop-down list, press Insert+Z to turn off the virtual PC cursor so that you can select an item from the list.
IBM and accessibility
See the IBM Human Ability and Accessibility Center for more information about the commitment that IBM has to accessibility.
Process Portal: What's new in BPM V8.5
The Process Portal that is available in V8.5 of BPM includes updates to the appearance and functionality from the Process Portal in BPM V8.0.
In V8.5, the ready-to-use dashboards that are included in Process Portal are redesigned. You can now manage the performance of processes, teams, and team members more effectively.
The main changes in BPM V8.5 compared to BPM V8.0 are summarized in the following table.
| Action | BPM V8.0 | BPM V8.5 |
|---|---|---|
| Monitor and act on process performance. | Click Dashboards > Process Performance
The Process Performance dashboard was known as the Process Performance scoreboard in releases before BPM V8.0. | Process Performance page.
The Process Performance dashboard replaces the dashboard of the same name that was based on the Process Performance scoreboard. As a process owner, you can use the redesigned dashboard for the following aspects of your work:
|
| Access the critical path management tool. | On the Work page, click the down arrow to the right of a process or task name and select Critical Path Management from the list of actions. | The critical path management tool in no longer a separate tool.
Critical path management is now integrated into the Process Performance dashboard for a process instance. The functionality is now known as projected path management. Use the Gantt View and Set Path pages to bring overdue and at-risk instances back on track. |
| Monitor and act on team performance. | Click Dashboards > My Team Performance
The My Team Performance dashboard was known as the My Team Performance scoreboard in releases before BPM V8.0. The My Team Performance scoreboard used manager groups that were specified in Process Admin Console. | Team Performance page.
The Team Performance dashboard replaces the dashboard that was based on the My Team Performance scoreboard. As a team manager, you can use the redesigned dashboard for the following aspects of your work:
See The Team Performance dashboard. The Team Performance dashboard uses manager teams specified in Process Designer, and requires that tasks be assigned to a team or a team lane. During a transition period, you might want to use the My Team Performance scoreboard for existing tasks and the Team Performance dashboard for new tasks. See the following topics:
|
| Monitor personal performance. | Click Dashboards > My Performance | This dashboard is not available by default.
If the dashboard is enabled for the Process Portal environment, you can access it by clicking the Organize tabs icon, and selecting My Performance from the list of hidden tabs. |
| Create ad hoc reports. | On the Dashboards page, click the down arrow and select Ad Hoc Reports. | You cannot create ad hoc reports by default.
If ad hoc reporting is enabled for the Process Portal environment, you can create ad hoc reports by clicking the Organize tabs icon and selecting Ad Hoc Reports from the list of hidden tabs. |
| Add pages to and remove pages from the Process Portal user interface. | Not available | Click the Organize tabs icon and move pages between the visible and hidden tabs sections. |
| View saved searches. | Click Work > Saved Searches tab | Click the Organize tabs icon and select a saved search from the list of hidden tabs. |
| Copy Process Portal page links to use in emails and documents. | Not available | To ensure the copied URL is well formed, use the Copy the page link icon. |
| Restrict access to actions on business processes and tasks. | Change the values of the action policies in the <default-action-policy> section of 100Custom.xml. | The Process Portal configuration properties for the action policies are now contained in configuration objects. See Process Portal action policies. |
| Customize dashboards. | Not available | Modify and extend the Process Performance and Team Performance dashboards by using Process Designer. In addition, you can create custom dashboards with the components provided in the Dashboards toolkit. See Customizing dashboards. |
Completing work on tasks with Process Portal
The Work page contains a list of the tasks that you own. The list also includes the tasks that are assigned to your team that you can claim to work on. Open a task to complete the work that is needed.
On an iPad, automatic refresh of the work view does not take place. Select Refresh to get recently claimed tasks to show up.
The tasks in the Work page are sorted into categories according to the due date for the work on the task. Each task in the list has an icon that indicates a level of priority. The background color of the Priority icon indicates the priority of the task:
- Red: Very high
- Yellow: High
- No color: Normal
- Blue: Low
- Gray: Very low
In addition, you can search for specific tasks by using the search field.
The following figure shows an example of a Work page.
Figure 1. The Work page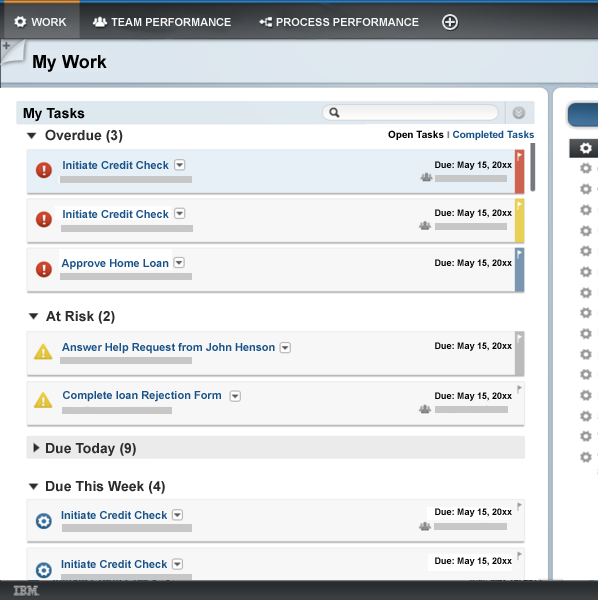
A task appears in only one category. Tasks that are at risk are determined by the average time it takes to complete a task of a particular type. For example, if you have a task that is due today but people need three days on average to complete the work on this type of task, then the task appears in the At Risk category and not the Due Today category.
To see more information about a task, such as the description or data relevant to the task, click anywhere within the task area. If the task can be completed directly from the Work page, this information is displayed too. To complete the work on all other tasks, open a task by clicking the task name.
Your list of tasks is automatically refreshed when new tasks are added to the list. In addition, the list of tasks is refreshed when a task that is assigned to your team is claimed by someone else, or the due date of a task is changed. You might have to open a task category to see the changes to the list.
When you open a task that is assigned to a team, you automatically become the owner of the task. By default, you receive a confirmation message the task will be assigned to you. You can turn off these messages from the confirmation window or by changing your user preferences. If you open a task by mistake, you can reassign it back to the designated team.
If you are authorized, you can perform other actions on tasks in the Work page by clicking the down arrow to the right of the task name.
- Task assignment in Process Portal: Frequently asked questions Answers to a set of frequently asked questions about task assignment and reassignment.
- Notifications that you can expect in Process Portal You can receive notifications directly in Process Portal when an action occurs that affects you and your work, for example, when a new task is assigned to you or your user group, or you are mentioned in a post on the process. You can use settings in the Process Portal preferences to control which notifications you see.
- Process Portal Work page: Search tips Quickly find a specific task in your list of tasks in the Work page.
- Work on tasks in Process Portal Tasks represent the work that must be done to complete a process. While you are working on a task, you can collaborate with other users in different ways to help you get your work done more efficiently.
Related concepts:
Process Portal Work page: Search tips
Related tasks:
Set preferences in Process Portal
Task assignment in Process Portal: Frequently asked questions
Answers to a set of frequently asked questions about task assignment and reassignment.
Which tasks do I have access to?
You have access to the following types of tasks:
- Tasks that are assigned directly to you.
- Your claimed tasks.
- Unclaimed tasks that are assigned to teams that you belong to.
- Tasks for which you are an expert.
- Tasks that you are collaborating on.
Who can I reassign my task to?
If you claim a task by mistake, you can reassign the task back to your team or you can reassign it to another team member. To reassign the task back to the team, select Reassign Back to Team from the actions list for the task. To reassign the task back to the team or to another team member, select Modify Task from the actions list for the task.
If you do not see any users when you are reassigning tasks, contact your system administrator. There could be too many users in the group that is eligible for the task.
When I enter a name, I get too many users back. How do I find the exact person that I am looking for?
For example, you entered ben as the user name, but the list of names contains all the users whose user names or display names include 'ben' anywhere within them, for example, benjamin, adminben, sam benwell. To limit this list of names to exactly who you are looking for, enclose the name you enter in quotation marks. For example, to reassign the task to ben, enter "ben".
Why is the Reassign back to team choice not available for my task?
This behavior occurs when the task was assigned only to you and not to one of the teams that you belong to. You can, however, assign the task to another user by selecting Modify Task from the actions list for the task.
I received an email notification of a task assignment. When I clicked the link, I got a Server not found error. What should I do?
This error indicates that email notifications are not set up correctly for the Process Portal environment. Contact your system administrator.
Related tasks:
Enable email for Process Portal notifications
Notifications that you can expect in Process Portal
You can receive notifications directly in Process Portal when an action occurs that affects you and your work, for example, when a new task is assigned to you or your user group, or you are mentioned in a post on the process. You can use settings in the Process Portal preferences to control which notifications you see.
This function is not supported for Safari on iPad.
You can receive notifications directly in Process Portal in the following situations:
- A new task is assigned to you or your user group.
- You are mentioned in a post on a process that you are participating in.
- You are invited to collaborate on a task.
Alternatively, you can choose to receive an email notification or an IBM Connections notification when you are assigned a new task. For IBM Connections notifications, you can claim tasks and complete work directly from the notification.
Regardless of your preferences settings, the @Mentions tab shows all the posts on the process that you were mentioned in and all your collaboration invitations.
Related tasks:
Set preferences in Process Portal
Enable email for Process Portal notifications
Enable IBM Connections integration
Process Portal Work page: Search tips
Quickly find a specific task in your list of tasks in the Work page.
If you are using Process Portal on an iPad or the language is set to Arabic or Hebrew in the Process Portal user preferences, searching and filtering in the dashboard pages work the same way as they do in the Work page.
In addition, only task-based saved searches are searchable.
Basic searches
The easiest way to search for a task is to enter terms in the search box that describe what you are looking for.
To clear the search results and return to your list of tasks, click the X icon in the search box.
The following table summarizes tips to make your searches more effective.
| What are you looking for? | What should your query look like? |
|---|---|
| Tasks that contain specific terms. For example, you are trying to find the loan application that you are working on for John Smith. | Enter the terms that describe what you are looking for. For example, John Smith loan. Although terms are automatically combined to narrow down the search, you can also use the AND operator to combine
terms, for example John AND Smith AND loan.
Because the search function is not case-sensitive, you can enter your terms in lowercase, uppercase, or a combination of lowercase and uppercase. For example
Search response time depends on the number of search hits. You can improve the response time by choosing search terms that are as explicit as possible and combining these terms with the AND operator. |
| Tasks that contain one term or another. For example, you are looking for all of your approval or rejection tasks. | To separate the terms that you are looking for,
use the OR operator. For example, to find tasks for either loan approvals or loan rejections, you can enter approval OR rejection
You can combine the OR operator with the AND operator. For example, to find all the approval or rejection tasks that are new, enter (approval OR rejection) AND new Always use uppercase characters for operators. |
| Tasks that contain one term but not another term | To include and exclude terms, use the plus (+)
and minus (-) operators together. For example, to find all of your tasks that contain the term loan but are not home loan tasks, enter +loan -home.
Always start this type of query with the plus (+) operator. You cannot use the minus (-) operator without the plus (+) operator. |
| Tasks that contain different variations of a term, for example, reject and rejection | Use a question mark (?) as a substitute for single characters in terms. For example, to find Meyer or Meier, enter Me?er
Use the asterisk (*) as a substitute for one or more characters at the beginning, end, or within a term. For example, to find both reject and rejection, enter reject* |
| Tasks that contain a set of terms in an exact order. For example, you are looking for all of your home loan approval tasks. | Put quotation marks around the terms. For example "home loan approval"
You cannot include wildcard characters, an asterisk (*) or a question mark (?), within the quotation marks. |
| Tasks that contain terms with nonalphanumeric characters, for example, an at sign (@), or an ampersand (&) | Put quotation marks around the terms. For example "johndoe@mycompany.com", or "Smith&Jones" |
Searching for specific types of information
To narrow down your search, you might want to search for specific types of information, such as the process instance name or terms in the subject line. In this case, you can prefix your search term with the corresponding field name. You can combine field searches with basic searches.
You can use the following task, and process instance fields in your searches.
| What are you looking for? | Which field should you use? | What terms should you include? | What should your query look like? |
|---|---|---|---|
| Tasks with a specific subject line | subject: | Any terms from the subject of the task |
|
| The tasks that belong to a process instance with a specific name | instancename: | Any terms from the process instance name |
|
| The tasks that belong to a process instance with a specific application name | application: | Any terms from the application name |
|
| Tasks that are at risk on a specific date, or during a date range | atriskdate: | The date in Coordinated Universal Time (UTC) in the format: year, month, day, [YYYYMMDD] expressed as a date range.
You can enter just the year [YYYY], or include hours, minutes, and seconds [YYYYMMDDHHMMSS]. Enclose each date in the date range in square
brackets.
To handle timezone issues, search from the day before to the day after the date that you are actually interested in. Use the TO operator to combine the dates. | All dates are UTC.
Remember: Always use uppercase characters for operators. |
| The tasks that belong to a specific business BPD | bpd: | Any terms from the business process definition name |
|
| The tasks that were created on a specific date, or during a date range | createdate: | The date in Coordinated Universal Time (UTC) in the format: year, month, day, [YYYYMMDD] expressed as a date range.
You can enter just the year [YYYY], or include hours, minutes, and seconds [YYYYMMDDHHMMSS]. Enclose each date in the date range in square
brackets.
To handle timezone issues, search from the day before to the day after the date that you are actually interested in. Use the TO operator to combine the dates. | All dates are UTC.
Remember: Always use uppercase characters for operators. |
| Tasks that are due on a specific date, or during a date range | duedate: | The date in Coordinated Universal Time (UTC) in the format: year, month, day, [YYYYMMDD] expressed as a date range.
You can enter just the year [YYYY], or include hours, minutes, and seconds [YYYYMMDDHHMMSS]. Enclose each date in the date range in square
brackets.
To handle timezone issues, search from the day before to the day after the date that you are actually interested in. Use the TO operator to combine the dates. | All dates are UTC.
Remember: Always use uppercase characters for operators. |
| The tasks that belong to a process instance with a specific ID | instanceid: | The numeric ID of the process instance | instanceid:57824 |
| Tasks with a specific name | activityname: | Any terms from the task name |
|
| A specific task ID | taskid: | The numeric ID of the task | taskid:12345 |
| Tasks that are owned by someone with a specific user login name | username: | The user name | username:jsmith |
| Tasks that are owned by someone with the specified name | userfullname: | All or part of a user's full name |
|
| Tasks assigned to a specific team | teamname: | All or part of the team name | teamname:accounting |
| All the tasks that have been claimed by users | isassignedtouser: | One of the following values: true, false. | For example, to find tasks that have not yet been claimed, enter isassignedtouser:false |
| What are you looking for? | Which field should you use? | What terms should you include? | What should your query look like? |
|---|---|---|---|
| The process instances that belong to a process with a specific application name | application: | Any terms from the application name |
|
| The process instances that belong to a process with a specific name | instancename: | Any terms from the process instance name |
|
| The process instances that belong to a specific business BPD | bpd: | Any terms from the business process definition name |
|
| Process instances that are at risk on a specific date, or during a date range | instanceatriskdate: | The date in Coordinated Universal Time (UTC) in the format: year, month, day, [YYYYMMDD] expressed as a date range.
You can enter just the year [YYYY], or include hours, minutes, and seconds [YYYYMMDDHHMMSS]. Enclose each date in the date range in square
brackets.
To handle timezone issues, search from the day before to the day after the date that you are actually interested in. Use the TO operator to combine the dates. | All dates are UTC.
Remember: Always use uppercase characters for operators. |
| Process instances that were created on a specific date, or during a date range | instancecreatedate: | The date in Coordinated Universal Time (UTC) in the format: year, month, day, [YYYYMMDD] expressed as a date range.
You can enter just the year [YYYY], or include hours, minutes, and seconds [YYYYMMDDHHMMSS]. Enclose each date in the date range in square
brackets.
To handle timezone issues, search from the day before to the day after the date that you are actually interested in. Use the TO operator to combine the dates. | All dates are UTC.
Remember: Always use uppercase characters for operators. |
| Process instances that are due on a specific date, or during a date range | instanceduedate: | The date in Coordinated Universal Time (UTC) in the format: year, month, day, [YYYYMMDD] expressed as a date range.
You can enter just the year [YYYY], or include hours, minutes, and seconds [YYYYMMDDHHMMSS]. Enclose each date in the date range in square
brackets.
To handle timezone issues, search from the day before to the day after the date that you are actually interested in. Use the TO operator to combine the dates. | All dates are UTC.
Remember: Always use uppercase characters for operators. |
| A specific process instance | instanceid: | The numeric ID of the process instance | instanceid:57824 |
Searches for business data
You can search for tasks that include data in fields that are specific to your business, for example customer name, customer address, or order date.
Business data fields are searchable only if the corresponding business data was made available to be searched when the process was designed.
You can use the following syntax for searches on business data.
| What are you looking for? | What should your query look like? |
|---|---|
| Terms in business data fields | Include the name of the field in your search.
To find the name of a field, in the task area for a task, hover over the label of the field. For example, if the label for the data is Customer Name and the hover help for the label shows customername, enter customername: |
| Terms that include any of the following special characters: + - ! ( ) { } [ ] ^ " ~ * ? : \ |
You cannot include wildcard characters, an asterisk (*) or a question mark (?), in search queries that contain special characters. |
| Numeric data in business data fields | To search for a number, for example 9 in the customer address field, enter customeraddress:9
To search for numbers in a range, use the TO operator. For example, if you are looking for numbers in the range from 1 through 9 in the customer address field, enter customeraddress:[1 TO 9] |
| Dates in business data fields | Enter the date in UTC in the format: year, month,
day, (YYYYMMDD) expressed as a date range. Use the TO operator to combine the dates in the range.
To handle timezone issues, search from the day before to the day after the date that you are actually interested in. For example, to find tasks that are associated with orders from 1 February 2012, use 31 January 2012 as the start date and 2 February 2012 as the end date. If the label for the order date field is orderdate, enter orderdate:[20120131 TO 20120202] |
- Comparison of field searches in Work pages and dashboard pages The terms that you use to search and filter specific fields differs in the Work page and the dashboard pages.
Related concepts:
Administer the Process Portal task index
Related tasks:
Making business data available in searches and views
Comparison of field searches in Work pages and dashboard pages
The terms that you use to search and filter specific fields differs in the Work page and the dashboard pages.
Task-specific search fields
You can use the following field names to search for and filter tasks in the Work page and the Team Performance dashboard pages.
| Field name in the Work page | Field name in dashboard pages |
|---|---|
| activityname: | Task |
| application: | Process Application |
| atriskdate: | At Risk Date |
| bpd: | Business Process |
| createdate: | Creation Date |
| duedate: | Due Date |
| instanceid: | Instance ID |
| instancename: | Instance Name |
| isassignedtouser: | Assigned |
| subject: | Subject |
| taskid: | Task ID |
| username: | User Name |
| userfullname: | User Full Name |
| teamname: | Team |
Instance-specific search fields
You can use the following field names to search for and filter instances in the Process Performance dashboard pages.
| Field name in the Work page | Field name in dashboard pages |
|---|---|
| application: | Process Application |
| bpd: | Business Process |
| instanceatriskdate: | At Risk Date |
| instancecreatedate: | Creation Date |
| instanceduedate: | Due Date |
| instanceid: | Instance ID |
| instancename: | Instance Name |
Work on tasks in Process Portal
Tasks represent the work that must be done to complete a process. While you are working on a task, you can collaborate with other users in different ways to help you get your work done more efficiently.
The following figure shows what you see when you open a task in Process Portal to work on it. The window includes the form for the task. To the right of the form is a tabbed area for collaborating with others.
Figure 1. Working on tasks in Process Portal
The following table describes each of the numbered areas in the preceding figure.
| Area | Description |
|---|---|
| 1 | The left part of the window contains the form that provides the details about the task, and where you provide information to complete the task. |
| 2 | To the right of the task name in the form is a down arrow. If you click the arrow, a list of actions that you can perform on the task is displayed. The actions that are available depend on the level of authorization that you have. When you open a task from the Work page, you become the owner of the task. If you open a task by mistake, you can return the task to the team by selecting Reassign Back to Team from the list of actions. |
| 3 | In the tabbed area to the right of the form, the Details tab provides information about the process instance to which the task you are working on belongs. The information includes business data, for example, the customer name, a link to the process diagram, a list of the completed tasks, and the tasks that are in progress. You can follow the process instance from this tab. If you are authorized, you can also act on the process instance by clicking the down arrow to the right of the instance name, and selecting an action from the list. |
| 4 | In the tabbed area to the right of the form, the Stream tab shows the activity on the process instance, such as when a task was created, claimed, or completed; and the comments that have been posted about the instance or the tasks that belong to it. You can post new comments here on the instance, or on the task that you are working on. Note that for the task started and the claimed stream entries, the timestamp indicates when the task was started or claimed, while the assigned group or user is the currently assigned task owner (not the task owner at the time the task was started or claimed). |
| 5 | In the tabbed area to the right of the form, the Experts tab shows the experts that are defined for the task that you are working on. You can directly interact with the people shown here so that you can complete your work more efficiently. |
- Getting help from experts to complete a task When you work on a task in Process Portal, you can see the experts that are defined for it. An expert is a team member with related task expertise who can help you with completing a task.
- Collaborating with other users to complete a task While working on a task in Process Portal, you might decide the most effective way to complete the work is to have someone work with you directly on the task. You can invite one or more users to collaborate with you.
Related tasks:
Getting help from experts to complete a task
Getting help from experts to complete a task
When you work on a task in Process Portal, you can see the experts that are defined for it. An expert is a team member with related task expertise who can help you with completing a task.
An expert can be either an experienced user or a subject matter expert.
- Experienced users
- Experienced users are selected by the system based on the number of tasks of the same type they have completed. For example, at the time you opened the Experts tab, the system found three users who previously completed one or more of the same task type, such as the Loan-Approve-or-Reject task, within the same process, such as the Loan-Approval process. The list is empty when the system cannot find any users who have previously completed this task type.
- Subject matter experts
- Subject matter experts are designated by your team and manually defined in the system for specific task types. If this feature is not configured on your system, the list is empty.
- See the list of experts that are defined for the task you are working on by clicking the Experts tab.
- Get help from an expert. You can get help from an expert in one of the following ways:
- Ask an expert a question. Click @Mentions and compose your message. Your post is added to the list of posts in the Stream tab. To send a comment to a specific user, type @ and then the user ID. As you type, a list of matching users is shown. Select a user and complete your comment.
- Work with an expert directly on your task by clicking Collaborate.
A collaboration invitation is sent to the expert.
- Start an instant messaging session with the expert. If IBM Sametime Connect is configured on your system and the expert is online, click Chat.
- Instant messaging in Process Portal: Frequently asked questions Answers to a set of frequently asked questions on the instant messaging service.
Instant messaging in Process Portal: Frequently asked questions
Answers to a set of frequently asked questions on the instant messaging service.
Why does the Chat option on the Experts tab not work for me?
If you and the expert to work with are both online but nothing happens when you click the Chat option, perform the following actions to check the environment is set up correctly.
- Check your browser settings. Ensure that you have not blocked pop-up windows.
- Depending on which browser you use.
- If you are using Internet Explorer, reload the page if you are prompted to do so when you start your chat session to accept the certificate for Sametime Connect.
If you are using Internet Explorer version 8, perform the following additional actions:
- In Internet Explorer, select Tools > Internet Options.
- On the Security tab, in the Security level for this zone section, click Custom level.
- In the Miscellaneous section, enable the Display mixed content setting, click OK to save the security settings, then OK again to save the internet options.
- Clear your browser cache, then restart Internet Explorer.
- In Internet Explorer, select Tools > Internet Options.
- If you are using a browser other than Internet Explorer, point your browser to the following URL, and accept the certificate for Sametime Connect.
- https://sthost:secureport/stwebclient/popup.jsp
Where:
- sthost
- The name of your Sametime Connect server.
- secureport
- The port for the Sametime Connect server.
-
If you are using Process Portal on a mobile device, such as an Apple iPad, you might have issues with receiving chat messages. If the Process Portal environment has Sametime Connect enabled,although you can start a chat session on your mobile device, other users might not be able to start chat sessions with you. Switch from the Sametime Connect tab to another tab, and then back again, and the missed message is displayed.
- If you are using Internet Explorer, reload the page if you are prompted to do so when you start your chat session to accept the certificate for Sametime Connect.
If you are using Internet Explorer version 8, perform the following additional actions:
- If you still experience problems starting a chat session, contact your system administrator.
Related tasks:
Configure Sametime integration
Collaborating with other users to complete a task
While working on a task in Process Portal, you might decide the most effective way to complete the work is to have someone work with you directly on the task. You can invite one or more users to collaborate with you. This function is not supported for Safari on iPad.
- Click the down arrow to the right of the task name and select Collaborate.
- Enter the name of the user or select a suggested collaborator, and then enter your message. You must invite each user individually. Each user that you invite receives an invitation to collaborate with you. When an invited user joins the task, a collaboration bar is displayed above the information for the task. Invited users join in the View mode.
- Allow an invited user to work on your task. In the collaboration bar, pass the editing rights to your invited user. Although you might have invited several people to help you with your task, you can collaborate with only one invited user in a collaboration session. In addition, only one person can edit the task at any one time. You can end the collaboration session at any time. In addition, if you close Process Portal while someone else is working on your task, the invited user can no longer work on your task.
If you or one of the invited users completes the task, it is moved to your list of completed tasks. Invited users with outstanding invitations can see the completed task on the Details tab for the process but they cannot make any changes to the task.
- Collaboration in Process Portal: Frequently asked questions Find answers to frequently asked questions about collaborating with other users in Process Portal.
Collaboration in Process Portal: Frequently asked questions
Find answers to frequently asked questions about collaborating with other users in Process Portal.
Who can I collaborate with?
You can invite people from the following groups of users to collaborate with you on a task:
- Subject matter experts for the task type
- Experienced users who have completed tasks of this type
- If the task was assigned to a team before you claimed it, anyone in this team
- If the task was assigned directly to you, anyone in the teams that you belong to
Why is the Collaborate action not available for my task?
This issue can occur for one of the following reasons:
- You are not the owner of the task. To be able to collaborate on a task, you must own it. If the task is assigned to a team, open the task so that you become the owner. If the task belongs to someone else, you must wait for the owner to invite you to collaborate on the task.
- The form the task uses does not support collaboration because it contains Heritage Coaches.
- Use one of the other collaboration options. Either post a comment on the task from the Stream tab or work directly with one of the experts for the task from the Experts tab.
- If you are a process designer, consider replacing the Heritage Coaches with a non-Heritage Coach.
- You have not opened the task within Process Portal. Collaboration is not available outside of Process Portal.
Can I collaborate with an expert if they are not online?
From the Experts tab for your task, you can see the expert whom you want to work with to complete your task. Although the expert is not online, you can still invite this person to collaborate on the task. After the expert logs on to Process Portal, the invitation is available in the @Mentions list.
When I enter a name, I get too many users back. How do I find the exact person whom I am looking for?
For example, you entered ben as the user name, but the list of names contains all the users whose user names or display names include "ben", for example, benjamin, adminben, sam benwell. To limit this list of names, enclose the name that you enter in quotation marks. For example, to collaborate with ben, enter "ben".
When I am editing a task, what should I do if the page stops responding or if the collaboration banner disappears?
If you are the task owner, restart the task from the task list. If you are the invited collaborator, restart the collaboration session by going to the original collaboration invitation and clicking the task link.
Related concepts:
Difference between Coaches and Heritage Coaches
Manage work for teams with the Team Performance dashboard
If you are a team manager, you can use the Team Performance dashboard in Process Portal to manage the work of the teams that you are responsible for.
You must be of a member of a team of managers to view data in the Team Performance dashboard.
- The Team Performance dashboard You can use the pages in the Team Performance dashboard in Process Portal to manage the work of the team members that you are responsible for. From the dashboard, you can see whether your team is catching up or falling behind on its work.
- Process Portal dashboards: Search tips While you are working with process instances or tasks in the Process Portal dashboards, you can filter the processes or tasks that are shown.
Related tasks:
The Team Performance dashboard
You can use the pages in the Team Performance dashboard in Process Portal to manage the work of the team members that you are responsible for. From the dashboard, you can see whether your team is catching up or falling behind on its work.
If you are the manager of more than one team, you can select the team to work on from the dashboard summary page. The Team Performance dashboard for an individual team contains the following pages:
Dashboard prerequisites
To work with the Team Performance dashboard, the following prerequisites apply:
- To see the Team Performance dashboard, you must be a member of the Managers team.
- To see tasks in the dashboard, the corresponding activities in the business process definition must be assigned to a lane or a team. Activities that have deprecated assignment options are not displayed in the dashboard.
- To manage a team's tasks, you must be a member of a team of managers. All snapshots of a process are considered when determining the authorisation for team management. If you are a member of a team of managers for any snapshot, you can manage the team's tasks
Overview page
This page gives you a broad view of where your team is with its current workload. All days and times are based on your time zone.
The Overview page has the following sections:
- Quick Stats
- Provides an overview of the tasks that are assigned to the team. This section includes counts for the open tasks and today's completed tasks. The open tasks are categorized as overdue, at risk, and on track. An at risk task is determined by the average time to complete a task of a particular type. For example, if a task is due today but people need three days on average to complete this type of task, then the task is considered to be at risk.
- Turnover Rate
- Provides an overview of the rate at which tasks are started and completed over time. The trend line indicates whether the team is catching up or falling behind with its work based on the difference between the task arrival and completion rates.
- Actions that you can take
-
- Change the time interval used on the x-axis. For example, to investigate the task completion or arrival rate during a day, change the time interval to Hours.
- See the net change for a bar in the chart by hovering over the bar.
- Roster
- The list of team members. For each team member, the list includes counts for the assigned tasks and today's completed tasks for all the teams to which the person belongs.
- Actions that you can take
-
- See the dashboard for an individual team member by selecting the person's name in the roster.
Team Tasks page
This page gives you a breakdown of the work in progress for the team. The information can help you to understand the status of your team's work and whether reallocating tasks to balance workloads is necessary. Use the search filter to display tasks in the list that meet certain filter criteria. All days and times are based on your time zone.
The Team Tasks page has the following sections.
- Time period histogram
- Histogram of the task due date and status over a period of time. The histogram is not available for completed tasks.
- Tasks list
- The list of all the tasks that are assigned to the team. By default, the list of tasks contains both assigned and unassigned open tasks. You can change the view to show completed tasks or just the open, unassigned tasks.
- Roster
- The list of team members. For each team member, the list includes the counts for the assigned tasks and today's completed tasks for all the teams to which the person belongs.
- Actions that you can take
-
- See the tasks for a specific due date and who they are assigned to by clicking a bar in the histogram. The tasks list shows the associated tasks. The people at the top of the roster own the tasks in the filtered list.
- Filter the tasks in the list by entering a search filter. The people at the top of the roster own the tasks in the filtered list. The histogram is also filtered to show only the tasks that apply to the search filter. Clear the filter by clicking the X icon at the end of the search filter field.
- Assign or reassign tasks in the list by hovering over an assigned name.
- See the dashboard for an individual team member by selecting the person's name in the roster.
- See the business data for the task by clicking on the shaded area of the task.
- Act on the task by clicking the arrow to the right of the task name and selecting an action from the list.
Team member's page
The page gives you an overview of the work in progress for each individual team member. All days and times are based on your time zone.
Because the page includes counts for all the tasks assigned to a team member, regardless of the team, it helps you understand a person's current workload. You can reassign tasks to other team members from this page.
A team member's page has the following sections:
- Quick Stats
- Provides an overview of all the tasks that are assigned to the team member, regardless of the team assignment. This section includes counts for the assigned tasks and today's completed tasks. The open tasks are categorized as overdue, at risk, and on track tasks. An at risk task is determined by the average time to complete a task of a particular type. For example, if a task is due today but people need three days on average to complete this type of task, then the task is considered to be at risk.
- Team member's tasks
- The list of your team's tasks that are assigned to the individual. If you manage multiple teams to which the team member belongs, the list shows all the member's assigned tasks for all of your teams. By default, the list of tasks contains the open tasks. You can change the view to show the completed tasks.
- Activity
- Provides and overview of the activity on the assigned tasks and posts for the team member. You can analyze the posts to see whether the team member might be having problems with the assigned tasks.
- Actions that you can take
-
- Filter the tasks in the list by entering a search filter. Clear the filter by clicking the X icon at the end of the search filter field.
- Reassign tasks in the list by hovering over the assigned name.
- See the business data for the task by clicking on the shaded area of the task.
- Act on the task by clicking the arrow to the right of the task name and selecting an action from the list.
Process Portal dashboards: Search tips
While you are working with process instances or tasks in the Process Portal dashboards, you can filter the processes or tasks that are shown.
If you are using Process Portal on an iPad or you set Contextual or RTL - Right to left as the base text direction in the Process Portal user preferences, searching and filtering work the same as they do in the Work page. For more information about searching in the Work page, see Search tips for the Work page.
For an introductory video about searching dashboards, watch "Searching in Process Portal dashboards in BPM", available on YouTube or the IBM Education Assistant information center. A transcript of the video is available.
How to search
On dashboard pages, a filter can consist of a field, such as Task ID or Instance ID, and a term, or just an individual free-text search term. As you type your filter, a list of the available fields is shown. Choose a field, or press Esc to continue typing your search term. Searches can include several filters.
- End your filter by pressing the Spacebar key twice, or by pressing the Right Arrow key.
- Apply your filters to the dashboard page by pressing Enter.
- Clear the filters by clicking the X icon at the end of the search filter.
The following default fields are available for search filters on dashboard pages. You might see additional business data fields that are specific to the environment. To see a list of all the available fields, enter an asterisk (*) as the search filter.
| Field name | Availability |
|---|---|
| Assigned
The value of this field can be either true or false. |
|
| At Risk Date |
|
| Business Process |
|
| Creation Date |
|
| Due Date |
|
| Instance ID |
|
| Instance Name |
|
| Process Application |
|
| Subject |
|
| Task ID |
|
| Task |
|
| Team |
|
| User Full Name |
|
| User Name |
|
How to construct filters
To make your searches more effective, consider the following suggestions for constructing filters.
| Filter criteria | What should your filter look like? |
|---|---|
| Include an exact phrase. | Put quotation marks around the words in the search term: "term"
For example, to find instances of home loan approvals, enter Instance Name "home loan approval" |
| Include variations of a term. | Use a question mark (?) as a substitute for single characters in terms. For example, to find Meyer or Meier, enter Me?er
Use the asterisk (*) as a substitute for one or more characters at the beginning, end, or within a term. For example, to find both reject and rejection, enter reject* |
| Narrow the search by combining filters. | Filters are automatically combined to narrow
your search: filter1 filter2. However, you can also use the AND or plus (+) operators to combine filters: filter1 AND filter2, or +filter1 +filter2.
If your filter contains a field, you can include only one search term in the filter. For example, to show tasks that mention both debit and credit in the subject line, you can enter the filters in one of the following ways:
Remember: Always use uppercase characters for operators. |
| Broaden the search. | To combine filters, use the OR operator: filter1 OR filter2
For example, to show items that contain debit, credit, or both using free-text search terms, enter Subject debit Space Space OR Space Space Subject credit In a filter that contains a field name, use commas between the search terms in the filter. For example, to show tasks for several different users, enter User Name Fred, Jim, Tim Remember: Always use uppercase characters for operators. |
| Exclude words from the search. | To exclude words from your search, use the NOT operator: filter1. NOT filter2 Alternatively, you can use the minus (-) operator: filter1 -filter2.
If your filter contains a field, you can include only one search term in the filter. For example, to show loan-related tasks that are not car loans, you can enter the filters in one of the following ways:
Remember: Always use uppercase characters for operators. |
| Include numeric data. | To search for a number, for example, 9, enter 9 as the search term.
In numeric fields, to search for a range of numbers, use the TO operator: filter1 TO filter2. For example, if you are looking for loan numbers in the range from 1 through 9 and the environment includes a numeric Loan Number field, enter Loan Number [1 TO 9] Searches for numeric data in text-based fields are always text based. Terms are identified based on whitespace and common punctuation. For example, if you enter Instance Name [1 TO 9], the search returns instances that have terms starting with the characters 1 through 9. Instance names, such as "Order 5", "Order 524563", "Order:5", "Order:524563" are returned because the first character of the term is between 1 and 9. However, instance names, such as "Order5" and "Order524563" are not returned because there is no whitespace or punctuation before the number. Remember: Always use uppercase characters for operators. |
| Include a date. | Use a date range. In the search term, enclose
the date range in square brackets: [YYYYMMDD TO YYYYMMDD]
To handle timezone issues, search from the day before to the day after the date that you are interested in. For example, to find tasks that are associated with orders that are due from 1 February 2012, use 31 January 2012 as the start date and 2 February 2012 as the end date in your filter: Due Date [20120131 TO 20120202] Remember: Always use uppercase characters for operators. |
| Combine several filters that contain field names with a free-text search term. | Put parentheses around the search filters that contain the field names.
The opening parenthesis is treated like a full-text search term. After the parenthesis symbol, press the Spacebar key twice, and then type your first field name. For example, to show tasks from the Loans process application that belong to Fred and mention car loan, enter (Space Space User Name Fred Space Space Process Application Loans Space Space) AND Space Space "car loan" Remember: Always use uppercase characters for operators. |
- Comparison of field searches in Work pages and dashboard pages The terms that you use to search and filter specific fields differs in the Work page and the dashboard pages.
- Searching in Process Portal dashboards This is the transcript for the Searching in Process Portal dashboards video.
Comparison of field searches in Work pages and dashboard pages
The terms that you use to search and filter specific fields differs in the Work page and the dashboard pages.
Task-specific search fields
You can use the following field names to search for and filter tasks in the Work page and the Team Performance dashboard pages.
| Field name in the Work page | Field name in dashboard pages |
|---|---|
| activityname: | Task |
| application: | Process Application |
| atriskdate: | At Risk Date |
| bpd: | Business Process |
| createdate: | Creation Date |
| duedate: | Due Date |
| instanceid: | Instance ID |
| instancename: | Instance Name |
| isassignedtouser: | Assigned |
| subject: | Subject |
| taskid: | Task ID |
| username: | User Name |
| userfullname: | User Full Name |
| teamname: | Team |
Instance-specific search fields
You can use the following field names to search for and filter instances in the Process Performance dashboard pages.
| Field name in the Work page | Field name in dashboard pages |
|---|---|
| application: | Process Application |
| bpd: | Business Process |
| instanceatriskdate: | At Risk Date |
| instancecreatedate: | Creation Date |
| instanceduedate: | Due Date |
| instanceid: | Instance ID |
| instancename: | Instance Name |
Manage processes and process instances with the Process Performance dashboard
The Process Performance dashboard shows the status of the processes that you own. It helps you to quickly identify bottlenecks in processes and to act on overdue or at risk process instances to bring them back on track.
- The Process Performance dashboard You can use the Process Performance dashboard in Process Portal to get an overview of the processes that you are responsible for. You can identify processes that need attention, go to individual instances, and act to bring them back on track.
- Process Portal dashboards: Search tips While you are working with process instances or tasks in the Process Portal dashboards, you can filter the processes or tasks that are shown.
- Resolve issues with process instances by using the Process Performance dashboard You can use the Process Performance dashboard in Process Portal to identify issues with process instances that are in progress. You can then use the dashboards for individual instances to take actions to resolve these issues, for example, by adjusting task due dates or priorities, or changing the path through the outstanding tasks.
The Process Performance dashboard
You can use the Process Performance dashboard in Process Portal to get an overview of the processes that you are responsible for. You can identify processes that need attention, go to individual instances, and act to bring them back on track.
If you are responsible for more than one process, you can select the process to work on from the dashboard summary page. The Process Performance dashboard for an individual process contains the following pages:
Dashboard prerequisites
To work with the Process Performance dashboard, the following prerequisites apply:
- To see the Process Performance dashboard, you must be a member of the Process Owner team.
- To see a specific process in the dashboard, you must be a member of the team that is assigned to the Expose Performance Metrics setting for the business process definition. Only the default snapshot is considered when determining whether you have access to a process.
- To see timing intervals in the Average Duration section, they must be specified for the business process definition.
Overview page
This page contains charts and graphs that help you visualize the progress of process instances. You can use the data provided to identify instances that need attention. In addition, you can filter the data using the search filter. All days and times are based on your time zone.
- If your administrator deleted completed instances from the system, these instances are not included in the performance statistics.
- Versions of BPM earlier than V8.5 do not store the completion date for process instances. Depending on how your administrator set up the Process Portal index, the average instance duration and instance completion statistics might not include instances that were completed in an earlier version of BPM.
The Overview page has the following sections:
- Quick Stats
- Provides an overview of the instances that are in progress. This section includes the average instance duration, and the total number of instances in progress, which are categorized as overdue, at risk,
and on track instances. An at risk instance is determined by the average time to complete instances of this process. For example, if an instance is due today but people need three days on average
to complete the outstanding work on the instance, then the instance is considered to be at risk.
- Actions that you can take
-
- Identify instances that are overdue or at risk by using the pie chart to filter the list of instances. Clear the filter by clicking the selected pie slice again.
- Turnover Rate
- Provides an overview of the rate at which process instances are started and closed; closed instances include both completed and terminated
instances. The trend line indicates how the process is performing in general and whether the work on it is catching up or falling behind based on the difference between the instance arrival and closure rates.
- Actions that you can take
-
- Change the time interval used on the x-axis. For example, to investigate the instance closure or arrival rate during a day, change the time interval to Hours.
- See the net change for a bar in the chart by hovering over the bar.
- Average Duration
- Provides different views of the average length of time that it takes to complete the tasks in the process. Only the statistics for closed instances are included in the views; closed instances include both completed and terminated instances.
If several tasks are close together on the timeline, use the zoom slider to see these tasks in more detail. However, the zoom slider is not available if the process completes in less than 10 minutes.
- Tasks
- The completed tasks in the process are shown as bars in the Gantt chart. The length of a bar indicates the average time that it takes to complete the task. The opacity of the bars indicates the percentage of instances in which the task occurs. The bars in the chart are staggered
according to the average start time.
Reworked tasks are indicated by an extra bar on the chart; a bar is added every time the task is reworked. A reworked task is a task that is performed multiple times. The reason for the rework might be because the work on the task does not meet the completion criteria. For example, if the work on a task requires an approval, and the approval is rejected, then the work on the task must be repeated one or more times until it is approved. The length of the bar indicates the average amount of time that is spent doing rework for the activity.
- Timing Intervals
- The bars in the chart show the average duration for the timing intervals.
- Instances in Progress
- Provides a list of the instances in progress. You can use the Quick Stats pie chart or the search filter to filter this list to identify the instances that need attention. Clear the filter by clicking the selected pie slice again.
- Actions that you can take
-
- See a summary of the instance that shows by how much an overdue or at risk instance might miss the deadline by hovering over an entry in the list.
- Pin open the instance summary if, for example, you want to compare several instances at the same time.
- Go to an instance by selecting the entry in the instances list. The dashboard for the instance is shown.
Diagram page
This page shows the overall status of the tasks in the open instances. Based on the information in the status indicators, you can identify which tasks are causing bottlenecks.
- Actions that you can take
-
- Identify instances that need attention by clicking the status indicator for a task. The instances list is filtered to show the instances that contain this task.
- See the tasks in linked processes or subprocesses by double-clicking the corresponding symbol in the diagram.
- Go to an instance by selecting the entry for the instance in the list. The dashboard for the instance is shown.
Related tasks:
Exposing Business Process Definitions
Enable process instance management for a BPD
Process Portal dashboards: Search tips
While you are working with process instances or tasks in the Process Portal dashboards, you can filter the processes or tasks that are shown.
If you are using Process Portal on an iPad or you set Contextual or RTL - Right to left as the base text direction in the Process Portal user preferences, searching and filtering work the same as they do in the Work page. For more information about searching in the Work page, see Search tips for the Work page.
For an introductory video about searching dashboards, watch "Searching in Process Portal dashboards in BPM", available on YouTube or the IBM Education Assistant information center. A transcript of the video is available.
How to search
On dashboard pages, a filter can consist of a field, such as Task ID or Instance ID, and a term, or just an individual free-text search term. As you type your filter, a list of the available fields is shown. Choose a field, or press Esc to continue typing your search term. Searches can include several filters.
- End your filter by pressing the Spacebar key twice, or by pressing the Right Arrow key.
- Apply your filters to the dashboard page by pressing Enter.
- Clear the filters by clicking the X icon at the end of the search filter.
The following default fields are available for search filters on dashboard pages. You might see additional business data fields that are specific to the environment. To see a list of all the available fields, enter an asterisk (*) as the search filter.
| Field name | Availability |
|---|---|
| Assigned
The value of this field can be either true or false. |
|
| At Risk Date |
|
| Business Process |
|
| Creation Date |
|
| Due Date |
|
| Instance ID |
|
| Instance Name |
|
| Process Application |
|
| Subject |
|
| Task ID |
|
| Task |
|
| Team |
|
| User Full Name |
|
| User Name |
|
How to construct filters
To make your searches more effective, consider the following suggestions for constructing filters.
| Filter criteria | What should your filter look like? |
|---|---|
| Include an exact phrase. | Put quotation marks around the words in the search term: "term"
For example, to find instances of home loan approvals, enter Instance Name "home loan approval" |
| Include variations of a term. | Use a question mark (?) as a substitute for single characters in terms. For example, to find Meyer or Meier, enter Me?er
Use the asterisk (*) as a substitute for one or more characters at the beginning, end, or within a term. For example, to find both reject and rejection, enter reject* |
| Narrow the search by combining filters. | Filters are automatically combined to narrow
your search: filter1 filter2. However, you can also use the AND or plus (+) operators to combine filters: filter1 AND filter2, or +filter1 +filter2.
If your filter contains a field, you can include only one search term in the filter. For example, to show tasks that mention both debit and credit in the subject line, you can enter the filters in one of the following ways:
Remember: Always use uppercase characters for operators. |
| Broaden the search. | To combine filters, use the OR operator: filter1 OR filter2
For example, to show items that contain debit, credit, or both using free-text search terms, enter Subject debit Space Space OR Space Space Subject credit In a filter that contains a field name, use commas between the search terms in the filter. For example, to show tasks for several different users, enter User Name Fred, Jim, Tim Remember: Always use uppercase characters for operators. |
| Exclude words from the search. | To exclude words from your search, use the NOT operator: filter1. NOT filter2 Alternatively, you can use the minus (-) operator: filter1 -filter2.
If your filter contains a field, you can include only one search term in the filter. For example, to show loan-related tasks that are not car loans, you can enter the filters in one of the following ways:
Remember: Always use uppercase characters for operators. |
| Include numeric data. | To search for a number, for example, 9, enter 9 as the search term.
In numeric fields, to search for a range of numbers, use the TO operator: filter1 TO filter2. For example, if you are looking for loan numbers in the range from 1 through 9 and the environment includes a numeric Loan Number field, enter Loan Number [1 TO 9] Searches for numeric data in text-based fields are always text based. Terms are identified based on whitespace and common punctuation. For example, if you enter Instance Name [1 TO 9], the search returns instances that have terms starting with the characters 1 through 9. Instance names, such as "Order 5", "Order 524563", "Order:5", "Order:524563" are returned because the first character of the term is between 1 and 9. However, instance names, such as "Order5" and "Order524563" are not returned because there is no whitespace or punctuation before the number. Remember: Always use uppercase characters for operators. |
| Include a date. | Use a date range. In the search term, enclose
the date range in square brackets: [YYYYMMDD TO YYYYMMDD]
To handle timezone issues, search from the day before to the day after the date that you are interested in. For example, to find tasks that are associated with orders that are due from 1 February 2012, use 31 January 2012 as the start date and 2 February 2012 as the end date in your filter: Due Date [20120131 TO 20120202] Remember: Always use uppercase characters for operators. |
| Combine several filters that contain field names with a free-text search term. | Put parentheses around the search filters that contain the field names.
The opening parenthesis is treated like a full-text search term. After the parenthesis symbol, press the Spacebar key twice, and then type your first field name. For example, to show tasks from the Loans process application that belong to Fred and mention car loan, enter (Space Space User Name Fred Space Space Process Application Loans Space Space) AND Space Space "car loan" Remember: Always use uppercase characters for operators. |
- Comparison of field searches in Work pages and dashboard pages The terms that you use to search and filter specific fields differs in the Work page and the dashboard pages.
Comparison of field searches in Work pages and dashboard pages
The terms that you use to search and filter specific fields differs in the Work page and the dashboard pages.
Task-specific search fields
You can use the following field names to search for and filter tasks in the Work page and the Team Performance dashboard pages.
| Field name in the Work page | Field name in dashboard pages |
|---|---|
| activityname: | Task |
| application: | Process Application |
| atriskdate: | At Risk Date |
| bpd: | Business Process |
| createdate: | Creation Date |
| duedate: | Due Date |
| instanceid: | Instance ID |
| instancename: | Instance Name |
| isassignedtouser: | Assigned |
| subject: | Subject |
| taskid: | Task ID |
| username: | User Name |
| userfullname: | User Full Name |
| teamname: | Team |
Instance-specific search fields
You can use the following field names to search for and filter instances in the Process Performance dashboard pages.
| Field name in the Work page | Field name in dashboard pages |
|---|---|
| application: | Process Application |
| bpd: | Business Process |
| instanceatriskdate: | At Risk Date |
| instancecreatedate: | Creation Date |
| instanceduedate: | Due Date |
| instanceid: | Instance ID |
| instancename: | Instance Name |
Resolve issues with process instances by using the Process Performance dashboard
You can use the Process Performance dashboard in Process Portal to identify issues with process instances that are in progress. You can then use the dashboards for individual instances to take actions to resolve these issues, for example, by adjusting task due dates or priorities, or changing the path through the outstanding tasks.
Use the Gantt View and the Set Path pages, you can take actions to resolve issues with overdue process instances, for example:
- Adjust individual task due dates.
- Change the priorities of individual tasks.
- Adjust the due dates and priorities of several tasks at one time.
- Adjust the workflow for the tasks that are not yet started.
- The Process Performance instance dashboard You can use the Process Performance instance dashboard in Process Portal to act on process instances to bring them back on track.
- Making multiple changes to process instance values in Process Portal The Process Performance instance dashboard can help you identify process instances that require attention. To resolve issues with an overdue process instance, you can change the settings of several tasks at one time.
- Auditing process data with the Process Performance dashboard In Process Portal, you can audit business data for process instances.
The Process Performance instance dashboard
You can use the Process Performance instance dashboard in Process Portal to act on process instances to bring them back on track.
The instance dashboard contains the following pages:
- Gantt View page
- Set Path page
For the Set Path page to be visible, both of the following prerequisites must be fulfilled:
- Projected path management must be enabled for the business process definition.
- You must be authorized to work with projected paths.
If at least one of these prerequisites is not fulfilled, you see the Diagram page instead of the Set Path page.
Dashboard prerequisites
To work with the Process Performance instance dashboard, the following prerequisites apply:
- Business process configuration
- The business process definition must be configured in the following way:
- To see or change a projected path, and to see future tasks on the Gantt View page, projected path management must be enabled for the business process definition.
- To see the traversed path and the projected path that is based on historical data on the Set Path page, autotracking must be enabled for all parts of the business process definition. If autotracking is not enabled, the traversed path is not shown and the projected path is based on the longest (also known as pessimistic) path through the process instance.
- Authorization
-
- To see a specific process in the dashboard, you must be a member of the team that is assigned to the Expose Performance Metrics setting for the business process definition.
- To act on a process instance, you must belong to a security group that is assigned to the following Process Portal action policies:
Required authorization for actions in the Process Performance instance dashboard
Actions on instances Required action policies - Act on the instance in the Gantt View and Set Path pages
- Change task dates
- Change the projected path
Save the changes
- ACTION_VIEW_PROCESS_DIAGRAM
- ACTION_CHANGE_CRITICAL_PATH
- ACTION_CHANGE_INSTANCE_DUEDATE
- View the projected path in the Gantt View page
- View the instance diagram with the projected path in the Diagram page
- ACTION_VIEW_PROCESS_DIAGRAM
- ACTION_VIEW_CRITICAL_PATH
- View completed tasks and tasks in progress in the Gantt View and the Diagram pages
- ACTION_VIEW_PROCESS_DIAGRAM
- Change the instance due date
- ACTION_CHANGE_INSTANCE_DUEDATE
Gantt View page
Use the Gantt View page to get an overview of the tasks in a process instance. The tasks are represented by bars in the Gantt chart. If the instance contains subprocesses or linked processes, the tasks from these elements are also shown as bars in the chart. The today, due date, and estimated completion lines help you determine whether an instance that is in progress is on track for completion.
- For tasks up to the today line, the chart shows the path that was taken through the tasks. The color of the task bar indicates the task status.
- For future tasks, if autotracking is enabled, the path is based on historical data for the process snapshot, otherwise the longest (pessimistic) path through the process instance is displayed. If the projected path contains parallel paths, only those tasks that are on the longest path through the instance are shown in the Gantt chart. The planned durations and due dates are used to determine the longest path. When you change the due dates or durations of the tasks in the projected path, the longest path might change, and different tasks are subsequently shown in the projected path. You can override the projected path by using the Set Path page. There are several routes, or paths, that can be followed to complete a process. If distinct paths from the start to end nodes are found, projected paths through the future tasks can be displayed on the diagram.
To resolve issues with the process instance, you can act on the process instance as a whole or on the individual tasks in the instance.
- Actions that you can take on the process instance
-
- Zoom in on the diagram to better see individual tasks that are close together on the timeline.
If the planned duration of the process is less than 25 minutes, the zoom slider is not enabled for the Gantt View page.
- Change the due date for an instance that is in progress by clicking Process Due Date.
- Adjust the due dates, durations, and priorities of several tasks at one time by clicking Batch Modify.
If the process instance contains a group of parallel tasks, you might not be able to change individual tasks within the group in the Batch Modify window.
- Zoom in on the diagram to better see individual tasks that are close together on the timeline.
The Gantt View page includes the following sections:
- Tasks in the process instance
- How a task is displayed depends on the state of the task. A task can have one of the following states:
- Completed tasks
- The colors of these tasks indicate whether they completed on track or they were overdue. The bar width indicates the total task time, which includes both the time spent working on the task, and the wait time before the work began.
Reworked tasks are indicated by an extra bar on the chart; a bar is added every time the task is reworked. A reworked task is a task that is performed multiple times. The reason for the rework might be because the work on the task does not meet the completion criteria. For example, if the work on a task requires an approval, and the approval is rejected, then the work on the task must be repeated one or more times until it is approved.
- Actions that you can take
-
- See the task details by clicking a task bar.
- Tasks in progress
- The colors of these tasks up to the today line indicate whether they are on track, at risk, or overdue. The due date of the task determines bar width. Reworked tasks are indicated by an extra bar on the chart; a bar is added every time the task is reworked. A reworked task is a task that is performed multiple times.
The reason for the rework might be because the work on the task does not meet the completion criteria. For example, if the work on a task requires an approval, and the approval is rejected, then the work on the task must be repeated one or more times until it is approved.
- If the work on the task is on track, the bar width indicates the amount of time between the start date and the due date.
- If a task passes the due date, but its duration to date is less than the historical average total completion time, the bar width indicates the average total completion time. The due date marker is shown at the planned due date. The task is overdue.
- If a task takes longer than both the due date and the average total time, the bar width indicates the time the task has taken to date plus 10% of the average total time. The additional time is shown as gray space on the future side of the today line. The due date marker is shown at the planned due date. The task is overdue.
- Actions that you can take
-
- Change the due date of a task that is in progress by dragging the due date marker to a new date.
- See the task details by clicking a task bar. From the task details, you can change the due date of the task.
- Future tasks
- The bar width is determined by the planned duration or due date of the task. If this information is not available, the historical average duration for tasks of the particular type determines the barwidth. If historical data is not available, the default task duration is 2 hours.
- Actions that you can take
-
- See the task details by clicking a task bar. From the task details, you can change the due date of the task. Subsequent tasks are automatically rescheduled.
- Change the flow through the future tasks on the Set Path page.
- Activity stream
- The stream contains the comments that were posted and the documents that were attached while work was being done while the process instance was being worked on. The stream comments can help you to identify past issues with tasks in the instance.
- Actions that you can take
-
- Comment on an existing post.
- Post a comment or attachment for today by clicking the + (plus) icon.
Set Path page
To see this page, projected path management must be enabled for the business process definition, and you must be authorized to work with projected paths. If at least one of these prerequisites is not fulfilled, you see the Diagram page instead of the Set Path page.
There are several routes, or paths, that can be followed to complete a process. If distinct paths from start to end nodes are found, projected paths can be displayed on the diagram. If autotracking is enabled for the process, the Set Path page displays the path that is most commonly taken through the process. This path is based on a sampling of the historical process instances for the snapshot of the process. You can filter these historical process instances by using a search filter. In addition, the path that has already been traversed is shown in blue. If autotracking is not enabled for the process, the Set Path page displays the longest (pessimistic) path through the process instance.
- Actions that you can take
- If a projected path is displayed, you can take the following actions:
- Change the projected path through the instance by changing the time period on which the historical data is based.
- Create a custom projected path by clicking the Set path icon and choosing the new path. Your changes are automatically reflected in the projected path on the Gantt View page. If the instance contains parallel paths, the custom path might affect the longest path through the instance and, therefore, the tasks that are shown in the Gantt chart. The custom path is applied to the process instance only after you click Save.
- Undo changes to the path by clicking Reset.
Making multiple changes to process instance values in Process Portal
The Process Performance instance dashboard can help you identify process instances that require attention. To resolve issues with an overdue process instance, you can change the settings of several tasks at one time.
- In the Gantt View page for a process instance, click Batch Modify.
If the process instance contains a group of parallel tasks, you might not be able to change individual tasks within the group in the Batch Modify window. The following table describes the available settings:
Task settings that you can modify in batch
If you select... Then specify... And then apply the update to... For... Reset to Current Which of the following values you want to reset to the current value: - Duration
- Due Date
- Priority
Changed values or only critical path values. Activities, Active Tasks, or Activities and Active Tasks Decrease Duration by % The numeric percentage by which you want to decrease the duration All values, changed values, unchanged values, or only critical path values Activities and Active Tasks Decrease Amount The setting to decrease (duration or due date) and the value for the amount. For the value specified, the duration or due date is decreased by that number of days. For example, if you specify 10, the duration or due date is decreased by 10 days. All values, changed values, unchanged values, or only critical path values Activities, Active Tasks, or Activities and Active Tasks Increase Duration by % The numeric percentage by which you want to increase the duration All values, changed values, unchanged values, or only critical path values Activities and Active Tasks Increase Amount The setting to increase (duration or due date) and the value for the amount. For the value specified, the duration or due date is increased by that number of days. For example, if you specify 10, the duration or due date is increased by 10 days. All values, changed values, unchanged values, or only critical path values Activities, Active Tasks, or Activities and Active Tasks Set Value The setting to change (duration, due date, or priority), and the value for that setting. For duration and due date, you can specify days. If you specify only a value, the duration or due date is set to that number of days. For example, if you specify only 10, the duration or due date is set to 10 days.
For priority, you can choose the new priority from the list.
All values, changed values, unchanged values, or only critical path values Activities, Active Tasks, or Activities and Active Tasks - Click Update Values. The Changes section shows the results of the updates.
- Review the pending changes to the values. When you change the duration or due date of an activity or a task, the durations and due dates of all subsequent activities and tasks in the projected path that are affected by the change are updated accordingly.
- Click Save to commit the changes.
Auditing process data with the Process Performance dashboard
In Process Portal, you can audit business data for process instances.
To audit process data, the following prerequisites must be met:
- You must have the appropriate authorization to audit process data. Auditing process data is limited to the security groups specified for the ACTION_VIEW_PROCESS_AUDIT action in the WebSphere Common Configuration Model (WCCM).
- You can only audit those variables that have been configured for tracking in Process Designer. The tracking definitions must also be available in Business Performance Data Warehouse.
- In the Work page, click the down arrow to the right of a task or process name, and select Audit History from the list of actions.
- Select the business variables that you are interested in from the list.
A list of tracked variables for the process appears that shows historical changes for each variable. You can see who made the change, the time of the change, old and new values, and the step or activity in the process at which the change occurred.
Related concepts:
WebSphere Common Configuration Model
Related tasks:
Restrict access to actions on BPDs and tasks
Sending tracking definitions to Performance Data Warehouse
Create ad hoc reports in Process Portal
In Process Portal, you can customized reports using business variable data from your processes.
Before you can create ad hoc reports in Process Portal, your administrator must expose the Ad Hoc Reports dashboard. In addition, autotracking, tracking groups, or both must be enabled for the BPD.
To perform ad hoc analysis and export report data, you must be a member of one or more participant groups to whom business data is exposed.
To save a report that you can make available to all members of a security group, you must be a member of the tw_admins or tw_authors group.
To view a saved report, you must be a member of the security group the report was made available to. Using ad hoc reporting, you can perform the following tasks:
- Create ad hoc reports from Process Portal, without having to first define a report in Process Designer.
- Generate dynamic reports in multiple display formats, for example, pie charts or bar charts.
- Bind business variable data to chart elements to customize your report displays.
- Export report data to a Microsoft Excel file.
- Click the Organize tabs icon, and select Ad Hoc Reports.
- On the Ad Hoc Reports page, click New Ad Hoc Report.
- From the Business Process list, select the name of the business BPD to use for the report.
- Define the content of the report.
- Select the variables for the X and Y axes from the corresponding bindings lists. When you select a binding type, a second list appears that contains the variables that are associated with the binding type that you selected. This list includes only those variables for which tracking is enabled in the BPD. For example, if you choose Auto-Tracked for the binding and no variables are being tracked for the BPD, Process Portal displays No tracked items in the list.
- Optional: Specify a sort order for the data on the X-axis.
- Optional: Specify how data is displayed on the Y-axis by selecting a function.
- Optional: Restrict the report to a specific time period by selecting a value from the Time Range list. If you select Custom Period, you can specify start and end dates for the reporting period.
- Optional: Filter the data for the selected variable by creating conditional statements in the Business Data Filter section.
- Select a layout for the report from the Chart Layout list.
- Click Refresh Chart to view the data in the chart preview.
Save the report by clicking Save as BPM Report or export the report to Microsoft Excel for further analysis of the data.
You cannot modify a report after you save it.
Related concepts:
Tracking IBM Business Process Manager performance data
Related tasks:
Exposing the Ad Hoc Reports dashboard
Exposing Business Process Definitions
Work with other Process Portal spaces
IBM Business Process Manager provides a set of widgets, the Human Task Management widgets, for working on processes and tasks. You can use these widgets to start, work on, and manage tasks and processes.
Templates are also provided for creating spaces that are targeted to different sets of users, for example, team leads or call-center staff. The way in which you work with the widgets depends on how spaces that contain them have been set up for the environment.
The following table summarizes which widgets you can use for typical actions on processes and tasks. The availability of widgets and the actions that are available depend on how the environment and the widgets are set up and configured.
| Action | Widgets that you can use |
|---|---|
| Start a process | Task Definitions |
| View the process progress | Process Information |
| Manage tasks | Tasks or My Team's Tasks |
| Assign and transfer tasks | Tasks or My Team's Tasks |
| Change the due date or priority of a task | Tasks, My Team's Tasks, or Task Information |
| Work on and complete tasks | Task Information |
| Escalate a task, for example, if it is overdue | Tasks or My Team's Tasks |
| Create a task, for example, to request help | Task Information or My Work Organizer |
| Attach and view documents related to a task | Task Information |
Use Process Portal with BPM for Microsoft SharePoint
Use IBM Business Process Manager for Microsoft SharePoint Add-On, you can do many things in Microsoft SharePoint that you can do in Process Portal, including:
- Launch processes from a list of BPM for Microsoft SharePoint processes.
- View and perform assigned tasks.
- Manage inflight processes, including starting and stopping process instances, viewing process diagrams, and reassigning tasks to balance workload.
- View real-time reports showing performance dashboards for individuals, teams, or business processes.
- Process Portal web parts Using Process Portal web parts, you can view data from Process Portal inside a Microsoft SharePoint site.
Process Portal web parts
Use Process Portal web parts, you can view data from Process Portal inside a Microsoft SharePoint site.
The administrator must have enabled Process Portal to run inside an HTML frame.
- Saved Search web part The Saved Search web part enables you to select a saved search from Process Portal to display. By default, the web part displays the Process Portal Inbox, which is a saved search.
- Process Start web part To view and launch BPM processes from a Microsoft SharePoint site, use the Process Start web part.
- ScoreBoards web part You can display BPM for Microsoft SharePoint performance data from a Microsoft SharePoint site using the ScoreBoards web part.
- Embedded web Site web part Use the BPM for Microsoft SharePoint Embedded web Site web part to display a report or Coach within a Microsoft SharePoint site. You can also display other types of web sites in the Embedded web Site web by providing a valid URL.
Saved Search web part
The Saved Search web part enables you to select a saved search from Process Portal to display. By default, the web part displays the Process Portal Inbox, which is a saved search. The Saved Search web part displays the same list of process instances as the Process Portal saved search that you select. You can launch a process instance directly from the Saved Search web part by clicking on the linked process instance. The Saved Search web part also supports business data columns.
To display the active tasks in the saved search, click Show Tasks. Click Show Instances to display a list of running process instances. The parameters of the saved search are used to determine which view of the instances is shown. For example, if you clicked Organize by Task when defining the search in Process Portal, then the search is displayed with the Show Tasks option selected by default.
To modify settings for the Saved Search web part, follow these steps:
- Click Force Refresh to manually request updated data from BPM.
- You can select a saved search to display in the web part.
Click the Current Saved Search menu, then select a saved search. In the Saved Search web part properties window, you can modify the following settings:
- Process Server URL: Set the name of the connected Process Server in the following format: http://<server_name>:<port>. For example, http://servername:19086.
- Authentication Mode: BPM for Microsoft SharePoint supports integrated authentication by default. The authentication mode is configured for each site page template and the sample site during installation, based on the authentication mode selected during the installation process. You can configure each web part to use either integrated or basic authentication. Click Edit Mode, then select the authentication mode for each page. If you select basic authentication, you must specify the authentication credentials for Process Server, including user name and password.
- Default Portal Saved Search: Click the Default Portal Saved Search menu, then select a saved search. The Process Portal Inbox is selected by default.
- Number of Tasks Per Page: Specify how many saved tasks to display in the Saved Search web part window.
Process Start web part
To view and launch BPM processes from a Microsoft SharePoint site, use the Process Start web part.
To view a list of BPM processes in the Process Start web part window, you must be a member of a team that has been given Expose to start access to one or more business process definitions (BPDs). You can run a process directly from the Process Start web part by clicking on the link to the process.
Configure the Process Start web part properties as follows:
- Process Server URL: Set the name of the connected Process Server in the Process Start web part properties window. Set the name of the connected Process Server in the following format: http://<server_name>:<port>. For example, http://servername:19086.
- Number of Favorites Per Page: Set the number of process that are displayed in the Process Start web part window.
- Authentication Mode: BPM for Microsoft SharePoint supports integrated authentication by default. The authentication mode is configured for each site page template and the sample site during installation, based on the authentication mode selected during the installation process. You can configure each web part to use either integrated or basic authentication. Click Edit Mode, then select the authentication mode for each page. If you select basic authentication, you must specify the authentication credentials for Process Server, including user name and password.
ScoreBoards web part
You can display BPM for Microsoft SharePoint performance data from a Microsoft SharePoint site using the ScoreBoards web part.
From the ScoreBoard launcher window, you can click the ScoreBoard name, for example My Performance or My Team Performance.
Configure the ScoreBoards web part properties as follows:
- Process Server URL: In the ScoreBoards web part properties window, you must specify the name of the connected Process Server. Set the name of the connected Process Server in the following format: http://<server_name>:<port>. For example, http://servername:19086.
- Number of ScoreBoards Per Page: Set the number of scoreboards to display in the ScoreBoards web part.
- Authentication Mode: BPM for Microsoft SharePoint supports integrated authentication by default. The authentication mode is configured for each site template and the sample site during installation, based on the authentication mode selected during the installation process. You can configure each web part to use either integrated or basic authentication. Click Edit Mode, then select the authentication mode for each page. If you select basic authentication, you must specify the authentication credentials for Process Server, including user name and password.
Default settings in Microsoft Office Outlook might prevent the scoreboards from being displayed. This issue occurs because, by default, home pages in Outlook are disabled for non-default stores. To enable the scoreboards:
- Add the Outlk12.adm Group Policy template file to the Group Policy Object Editor.
- Expand User Configuration > Microsoft Office Outlook 2007 > Tools|Options > Other > Advanced.
- In the Setting column, double-click Do not allow folders in non-default stores to be set as folder home pages.
- On the Setting tab, click Disabled.
To obtain the 2007 Office System Administrative Templates
(ADM), go to the Download website.
To open the Local Group Policy Editor from the command line, click Start, type gpedit.msc in the Start Search box, and then press Enter.
Embedded web Site web part
Use the BPM for Microsoft SharePoint Embedded web Site web part to display a report or Coach within a Microsoft SharePoint site. You can also display other types of web sites in the Embedded web Site web by providing a valid URL.
Configure the Embedded web Site web part as follows:
- Process Server Base URL: In the Embedded web Site web part properties window, you must specify the name of the connected Process Server. Set the name of the connected server in the following format: http://<server_name>:<port>. For example, http://servername:19086, or you can specify the URL of another connected web site.
- Redirect URL Template: Specify a template to use when building
the embedded web site. This template determines what process information is displayed in the Embedded web Site web part during runtime. There are two template types, Template A or Template B, that you can specify in the Redirect URL Template field. Each template can be used with either basic authentication mode or integrated authentication mode, but the syntax for each template differs according to the authentication mode. The following table describes the syntax of the redirect template for the two authentication modes.
Redirect templates for basic or integrated authentication modes
Authentication Mode Redirect URL Template A Redirect URL Template B Basic {0}/portal/j_security_check?j_username={1} &j_password={2}&j_forward={3} {0}/teamworks/redirect-login.jsp?j_username={1} &j_password={2}&j_forward={3} Integrated {0}/portal/{3} {0}/teamworks/{3} - Relative Redirect URL: This field specifies the type of data to display, for example saved searches, ScoreBoards, reports,
or Coaches, in the context of the specified redirect URL template.
You can use the following table to determine which data types are compatible with each redirect URL template, either Template A or Template B.
Relative redirect URL for each display type and template
Display Type Relative Redirect URL with Template A Relative Redirect URL with Template B Saved search (Inbox) jsp/getSavedSearch.do Saved search (History) (search=X) jsp/getSavedSearch.do? startsWith=0&search=X
jsp/getSavedSearch.do?search=X
ScoreBoard (id=X) jsp/viewScoreboard.do?id=X Report (ReportId=X) reportDetails.lsw?zPageId=51 &zReportId=X
reportDetails.lsw?zReportId=X
Coach (TaskId=tX) process.lsw?zWorkflowState=1 &zTaskId=tX Example: Integrated authentication mode is selected in the Embedded web Site web part properties. To use Redirect Template A with integrated authentication mode, the value {0}/portal/{3} is entered in the Redirect URL Template field. To display the saved search inbox in the Embedded web Site web part, the value jsp/getSavedSearch.do is entered in the Relative Redirect URL field. The result of these settings is the saved search inbox is displayed in the Embedded web Site web part at runtime.
When entering the Relative Redirect URL field value for saved searches (history), ScoreBoards, reports, and Coaches, you must specify the ID number of the item you want to display. To determine the ID number of an item in Process Portal, hover over the item. The ID number appears in the status bar at the bottom of the web browser window.
- Authentication Mode: BPM for Microsoft SharePoint supports integrated authentication by default. The authentication mode is configured for each site template and the sample portal during installation, based on the authentication mode selected during the installation process. You can configure each web part to use either integrated or basic authentication. Click Edit Mode, then select the authentication mode for each page. If you select basic authentication, you must specify the authentication credentials for the Process Server, including user name and password.