|
3.8.3 Monitoring with the Tivoli Performance Viewer
The Tivoli Performance Viewer is the built-in monitoring console provided with the WebSphere administrative console. WebSphere administrators typically use it within the application server environment to monitor performance metrics (PMI metrics) for items such as memory usage and thread and connection pool utilization. WebSphere eXtreme Scale adds more PMI metrics into the same interface. These metrics provide more information about how eXtreme Scale is running within a given application server.
The Tivoli Performance Viewer can be used for obtaining eXtreme Scale statistics such as:

| Sizing: The number of entries and size of map
|
|
| Cache statistics: Includes cache retrievals and hit rates
|
|
| Performance: Retrieval response times
|
|
Tip: You can use PMI to monitor the environment only when you are using eXtreme Scale with WebSphere Application Server. If you have a stand-alone deployment of eXtreme Scale, then you need to use the eXtreme Scale web console (see Section 3.8.1, Using the eXtreme Scale web console).
|
By default, the Tivoli Performance Viewer does not show all PMI statistics. To see the performance statistics for the grid, you need to enable the ObjectGrid and ObjectGrid Maps modules. To do this, use the following procedure for each of the grid cluster members:
| 1.
| In the administrative console for the WebSphere process hosting the eXtreme Scale grid, click Monitor and Tuning Ć Performance Monitoring Infrastructure (PMI).
|
| 2.
| Click the grid container server, for example, XS_GridCluster_Member1.
|
| 3.
| Verify that Enable Performance Monitoring Infrastructure (PMI) is selected.
|
| 5.
| Click ObjectGrids on the left side. Select the ObjectGrid counters in the panel on the right and click Enable. The counter status changes to Enabled, as shown in Figure 3-16.
|
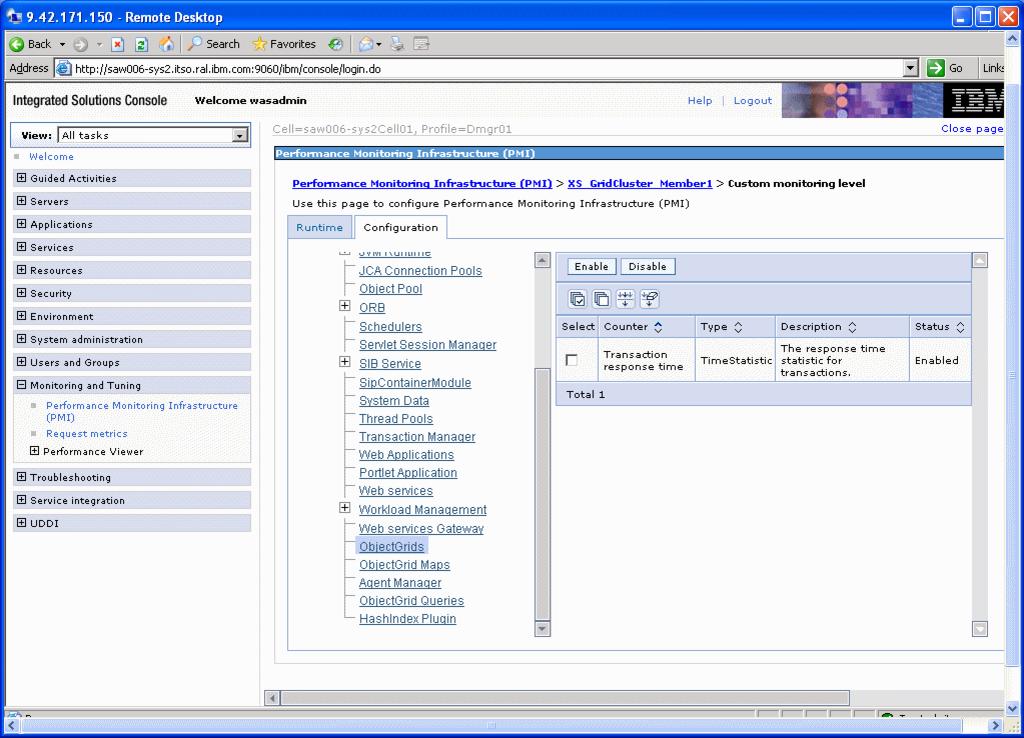
Figure 3-16 ObjectGrid PMI configuration
| 6.
| Next, click ObjectGrid Maps on the left side. Select all of the ObjectGrid Map counters listed in the panel on the right and click Enable. The counter status will changes to Enabled, as shown in Figure 3-17.
|
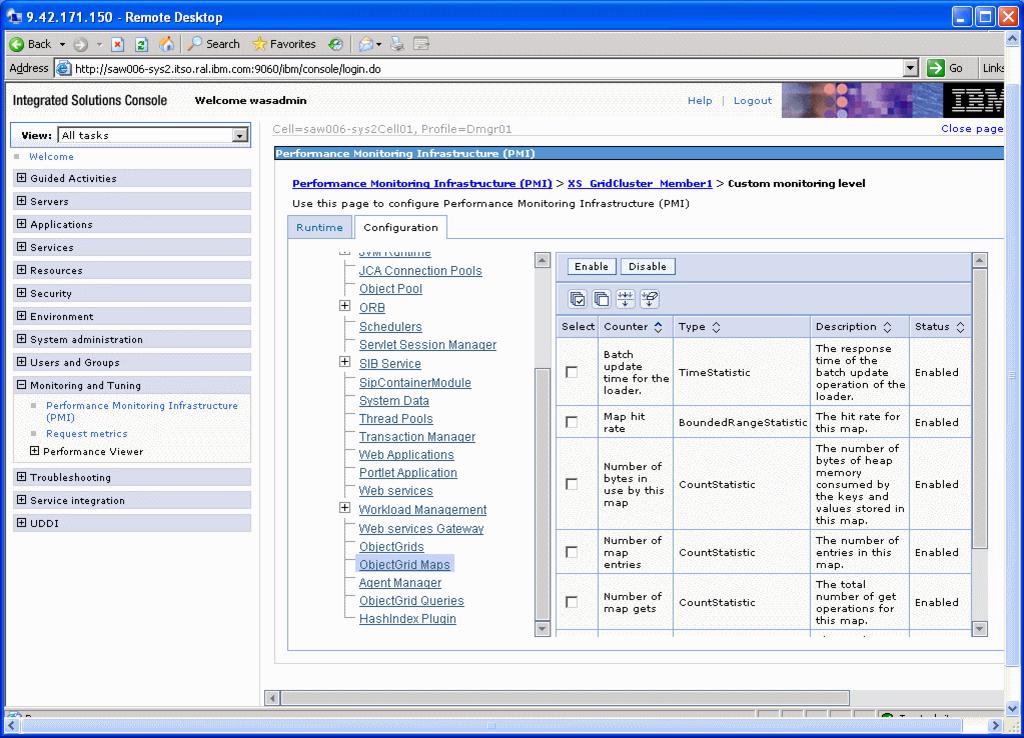
Figure 3-17 ObjectGrid Maps PMI configuration
| 8.
| Synchronize the node and restart the grid cluster.
|
After the PMI statistics for eXtreme Scale have been enabled, you can see grid counters in the Tivoli Performance Viewer. Use the following procedure to view the grid counters.
| 1.
| in the administrative console, click Monitoring and Tuning Ć Performance Viewer Ć Current Activity.
|
| 2.
| Select the grid cluster servers that to monitor and click Start Monitoring.
|
| 3.
| Click a monitored server to open the Tivoli Performance Viewer for that server.
|
| 4.
| Expand Performance Modules on the left side and select the modules under ObjectGrids and ObjectGrid Maps that to view.
|
| 5.
| When the view refreshes, the performance statistics display, as shown in Figure 3-18.
|
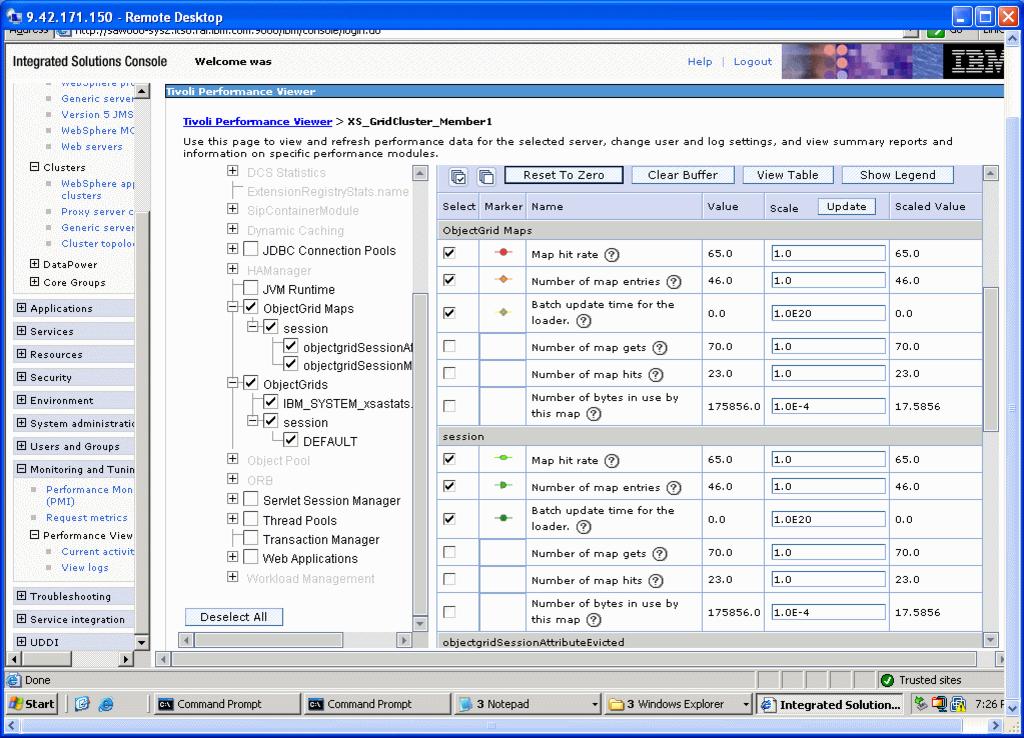
Figure 3-18 Object grid monitoring using the Tivoli Performance Viewer
|