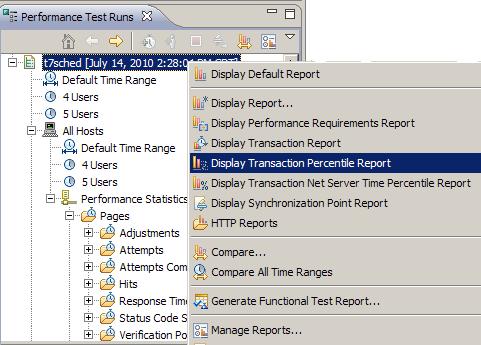
Transaction Percentile report
The Transaction Percentile report shows the 85th, 90th, and 95th percentile execution times for all users and the union of all transactions in a run, as well as for the 10 slowest transactions in a run.

The default percentiles in this report, 85, 90, and 95, are sufficient for most purposes.
To report on a different percentile set...
-
Window | Preferences | Test | Percentile Analysis Targets
...to change the percentiles in this report and in the Percentile report.
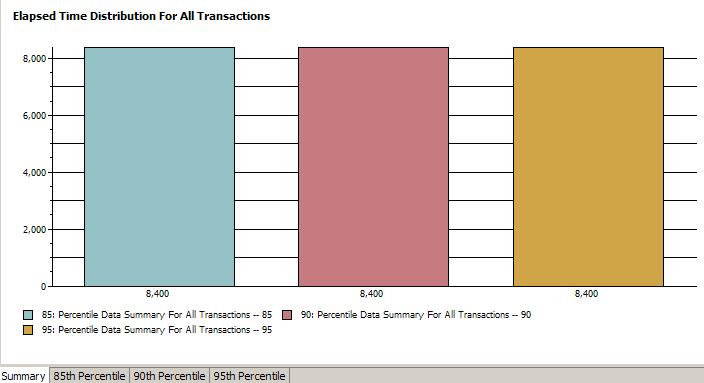
The Summary page of this report has a graph with three bars, which represent the 85th percentile, 90th percentile, and 95th percentile execution times for all users and for all transactions in the run.

For the 85th percentile bar, 85% of all users achieved the indicated execution time or better. For the 90th percentile bar, 90% of all users achieved the indicated execution time or better. And for the 95% percentile bar, 95% of all users achieved the indicated execution time or better.
The 85%, 90%, and 95% pages show the execution-time percentiles of the 10 slowest transactions in the run.
For example, if you click the tab for the 85th percentile, and the total for a transaction is 110 (the total is beneath each bar), you know that 85 percent of the execution times for that transaction are less than or equal to 110 milliseconds (ms).
This graph provides an overall idea of the execution times for each transaction.
For example, the Transaction report might indicate that a Login transaction is one of the 10 slowest transactions. However, it is possible that only one instance of the Login transaction was extremely slow while the other instances of the Login transaction were within acceptable range. The Transaction Percentile report shows which transactions have slow execution time averages because they were slow in general, not because a few execution times (out of many) were extremely slow.
The table beneath the graph provides more detailed information for each transaction:
- The minimum execution time for the run.
- The average execution time for the run.
- The standard deviation of the average execution
time. The standard deviation tells you how tightly the data is grouped
about the mean.
For example, System A and System B both have an average execution time of 12 ms. However, this does not mean that the execution times are similar. System A might have execution times of 11, 12, 13, and 12 ms. System B might have execution times of 1, 20, 25, and 2. Although the mean time is the same, the standard deviation of System B is greater—and the execution time is more varied.
- The maximum execution time for the run.
- The 85th percentile for the run. That is, for this particular transaction, 85% of the execution times were equal to or faster than this time.
- The 90th percentile for the run. That is, for this particular transaction, 90% of the execution times were equal to or faster than this time.
- The 95th percentile for the run. That is, for this particular transaction, 95% of the execution times were equal to or faster than this time.
- The number of attempts in the run.