Filter results
Overview
By filtering the results that are displayed in a report, you can remove unnecessary data and focus on the data that is significant to you. If you save the changes, the report will contain these updates the next time that you generate it.Filter Results
-
To apply a filter, do the following:
- In the Test Navigator, double-click the results that to filter. The report opens.
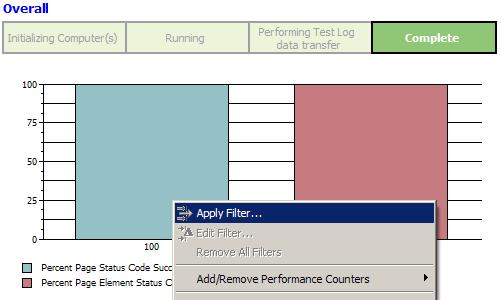
- Hover over the graph or report to be filtered, right-click, and then select Apply Filter
To edit a specific filter open the Performance Test Runs view, expand the tree and select the filter to edit.
- In the Performance Counter Filter window, select one of the following options:
Option Description Filter by count Display the specified number of items. 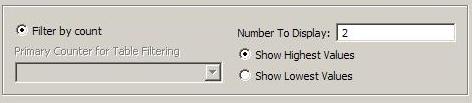
For example, if you select this option and then type 15, the report will show the 15 items with the highest values (Show highest values) or the 15 items with the lowest values (Show lowest values).
Filter by value Display items based on a comparison with the specified value. 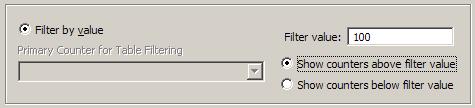
For example, if you select this option and then type 15, the report will show all of the items that are higher than 15 (Show counters above filter values) or lower than 15 (Show counters below filter value).
Filter by label Display items that match the specified label. 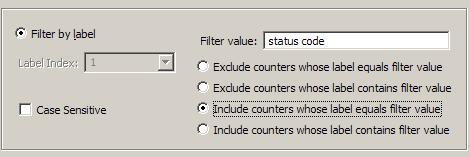
If you are filtering a table, the label is usually a page, and is listed in the left column.
If you are filtering a graph, the label is a legend in the graph.
- If you are filtering a table by count or value, the Primary counter for table filtering lists the counters in the heading of the table that you are filtering.
Select a primary counter. If a value is removed by the primary filter, all other data occupying the same row as the removed value is also removed. This maintains the integrity of the results.
- If you are filtering by label and a report has unlabeled columns, the Label Index is available to indicate which column you are filtering.
For example, the following table has two columns: the first for the page name and the second for the page element URL. You would enter a label index of 1 or 2.
- Click OK. The report is immediately updated, and if you save the changes upon exiting, the report will contain these updates the next time that you generate it.
Results
Reports and graphs that are filtered are marked as filtered, so that you are aware of the filtering when you reopen them.
- To remove a filter, hover over the filtered graphic, right-click, and select...
-
Remove All Filters
- To remove a specific filter, open the Performance Test Runs view, expand the report that has the filter, right-click the filter, and select Delete.