Choose page elements to view
- Right-click any page response graphic (for instance, a bar in a bar chart) to display the pop-up menu.

- Select Display Response Time Breakdown Statistics.
The Page Element Selection wizard opens. The primary page element is selected by default.
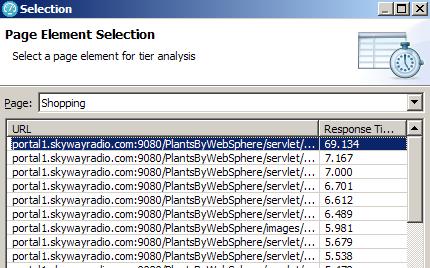
- Select the page element to analyze, and click Finish to display the response time breakdown report. The response time breakdown report opens.

- To return to the original report, use the navigation information in the upper left corner.