Add IBM WebSphere Performance Monitoring Infrastructure sources
Overview
To capture resource monitoring data from the IBM WebSphere Performance Monitoring Infrastructure, configure the data source.
Configure the IBM WebSphere PMI data source
- Open a schedule and go to the Resource Monitoring panel.
- Add the bottom of the page, click Add, then select an existing data source or create a new datasource.
- On the Location page, specify the connection and authentication information for the instance of WAS to use to capture resource monitoring data.

To change the SOAP port used to communicate with the computer that is running WAS, change the Connection information.
- If administrative security is enabled on the computer running WAS...
- Select...
-
Administrative security enabled
- Type the user ID and password for WAS in Authentication.
- Select Save Password to save password locally.
If you do not save password, you might be prompted for it (depending on the host system configuration) when you edit the configured location or when you run test schedules that use the location.
- Select...
- On the Resource page, select the type of data to capture.
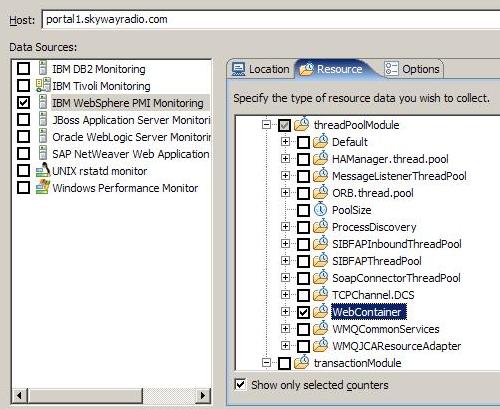
Be selective, monitoring all possible resource data requires substantial amounts of memory.
To see all available counters select clear the check box...
-
Show only selected counters
Hold mouse pointer over a counter to see details about what that counter measures.
- Configure the options on the Options page.

- Click Reset counters at start of run (client side reset only) to set the counters to 0 at the start of a schedule run.
This does not change the actual values of the counters on the application server. Instead, the recorded values of the counters are corrected to start at 0.
For example, if you monitor the ServletRequestCount counter, it starts at 0 instead of its previous value.
- Type the Polling Interval in seconds, for collecting resource data.
For example, if you accept the default of 5 seconds, counter information will be collected at 5-second intervals from the specified host during the schedule run.
- Type the Timeout Interval in seconds.
If the resource monitoring host does not respond within this amount of time during a schedule run, an error will be logged.
- Click Reset counters at start of run (client side reset only) to set the counters to 0 at the start of a schedule run.
Related