Rational Performance Tester v8 Overview
- Introduction
- Overview of this article
- Interactive graphical test
- Record a test
- Datapooling
- Associating a page with a datapool
- Workload breakdown and assignment
- Real-time system monitoring
- Real-time report analysis
- Versioning
- Adding custom code and extending tests
- Scaling and maintenance
- What's next
- Resources
Introduction
Rational Performance Tester identifies performance bottlenecks in...
- network
- database
- application server
- user application
The root cause analysis capability analyzes application tiers, including...
- EJBs
- servlets
- JDBC
- Web services
The default supported protocols, such as HTTP and HTTPS, allow us to run the load tests on Web applications. Several extensions are also available:
- IBM Rational Performance Tester Extension for Citrix Presentation Server
- IBM Rational Performance Tester Extension for SOA Quality
- IBM Rational Performance Tester Extension for Siebel Test Automation
- IBM Rational Performance Tester Extension for SAP Solutions
Rational Performance Tester works in a way similar to recording a video clip using a camcorder, allowing us to record the steps that you want to run load test on, and then replay the steps with the appropriate user loads.
Interactive graphical test
IBM Rational Performance Tester v8 uses Eclipse framework V3.2.
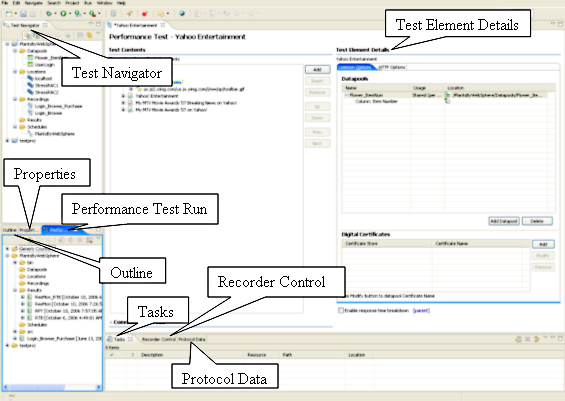
The default test perspective provides a four-pane console with the corresponding views, such as...
-
General | Outline | General | Properties | Test | Performance Test Runs
To add view to your workspace...
-
Windows | Show View | Other
We can customize a perspective to include or exclude views.

Record a test
- Create a test project.
-
File | New | Performance Test Project
Enter the project name when prompted.
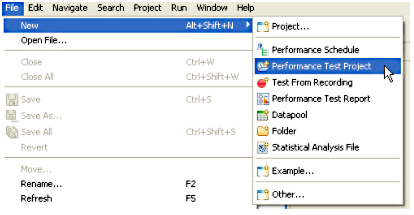
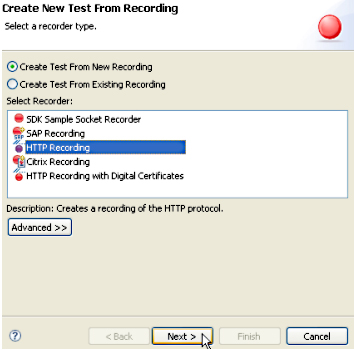
- Choose the record. For a Web application, choose HTTP recording. Click Next.
- On the next page, choose the test project for the test script that you named.
- We can capture any Web URL for the application under test when you see the screen. When you are satisfied with your recording, click Exit Recorder. We can now proceed to refining your test script (by clicking) and replaying it in any manner.

After you have recorded your test script, what's left is normally the refinement of test schedule. For example, you can customize your script in these ways, among others:
- Add delay time between each virtual user, user "think time," and statistical-level settings
- Define your own Datapools.
- Correlate data, to ensure a smooth flow of meaningful data from page to page.
- Add verification points, to examine the passing rate of each page under test.
- Add protocol-specific elements, transactions, a loop, a comment, conditional processing, and custom code
Datapooling
IBM Rational Performance Tester can supply variable data to dynamically load test data, either from...
- CSV file
- custom code
Datapooling substitutes data where input is required. For example, to test the ACME online shopping cart application, after logging in, users will...
- search using particular keywords
- browse the catalog
- pick the items that they like
- type in particulars
- add comments
- evaluate their shopping experiences
- check out by specifying a payment method
A datapool can be created for user login, searching keywords, and so on.
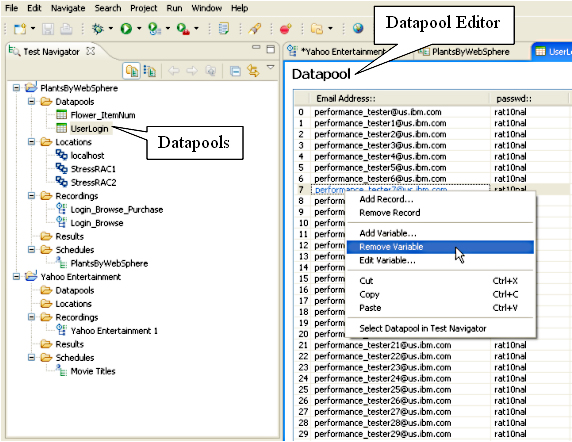
We can perform the following actions on the imported datapool:
- Add a record
- Remove a record
- Add a variable
- Edit a variable
- Remove a variable
A typical test case comprises multiple pages and, depending on the nature of the pages, there could be variables required for each page. This user input is encapsulated in HTML form and posted by either the get or post methods. We can create Datapools that correspond to each page by naming them accordingly. For example, to effectively test an end-to-end Web application, the Datapools may consist of pools such as...
- UserLogin
- SearchString
- ItemName
- PaymentMethod
To associate a datapool with a page:
- Right-click the Datapools folder or anywhere within the Test Navigator.
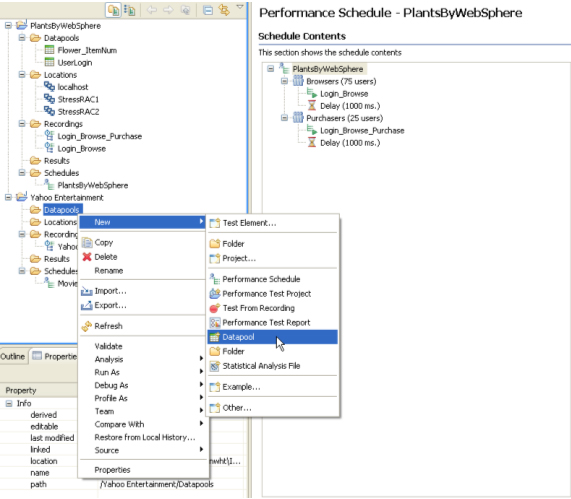
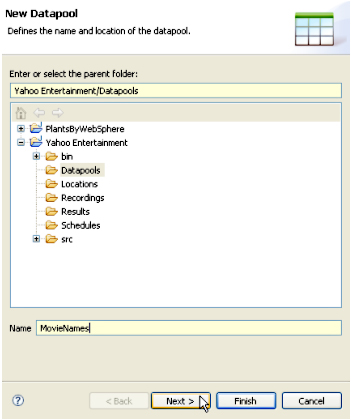
- Next, specify the name that the appropriate the new datapool will fall under. In this example, it is under the Yahoo Entertainment > Datapools folder. Give it a name before clicking Next.
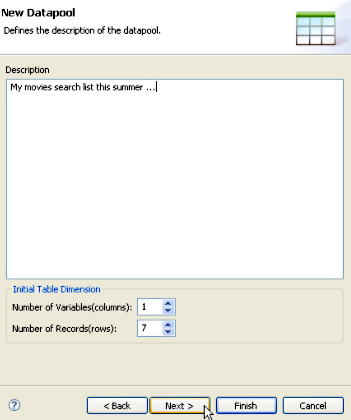
- We can create a datapool of any columns and rows. Providing a description is optional.
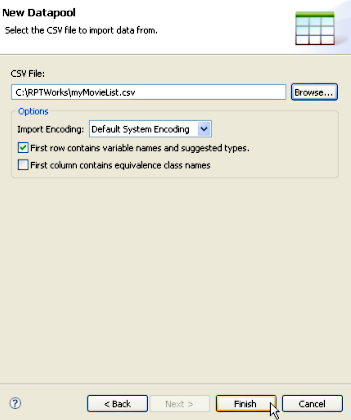
- Browse to the desired CSV file (which we need to have created previously). Click Finish to finish adding the datapool.
Associating a page with a datapool
- From the Performance test recording's test data section, highlight the row to substitute with the datapool, and then click Data Variable.
The URLs with query strings will be detected automatically and displayed in a dark green color.
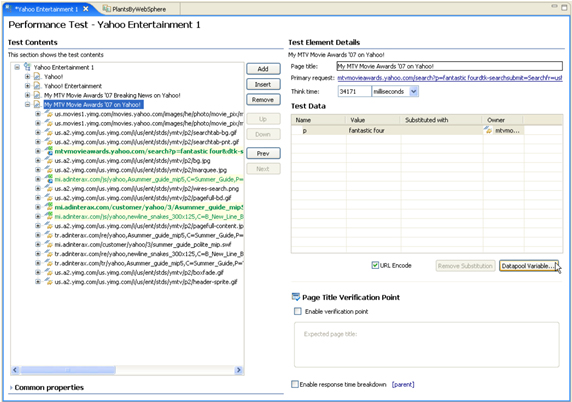
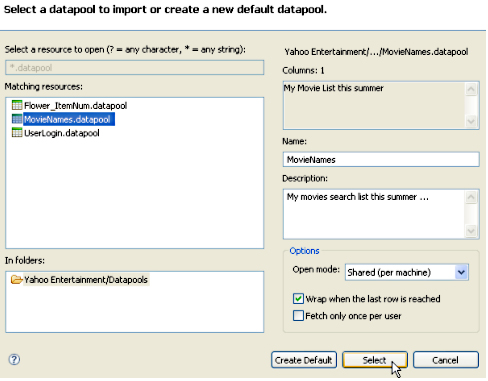
- Click Add Datapool, click on the datapool that you want to add, and then click Select..
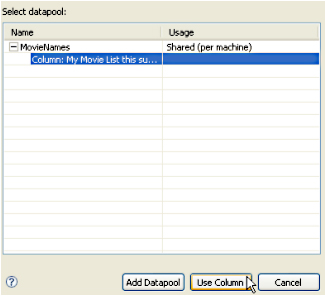
- To finish associating a datapool with a page, navigate to the column and click the Use Column button
The IBM Rational Performance Tester datapool feature enables us to substitute varying data, based on the varying pages navigated, thereby avoiding more complex alternatives, such as custom coding. We can build test cases based on different combinations of page navigation, and associate each page that requires user input with one or more Datapools. However, for truly scalable test cases built by using a huge set of test data, substituting Datapools may not be the best solution. In those situations, you can use the custom code capability. For example, a Java developer can plug in custom code to pull in a huge set of data on the fly. (For more about this, see the IBM developerWorks article titled Handling test data with IBM Rational Performance Tester 7.0: Part 2. Using files for very large sets of test data.)
The ability to substitute a pool of data on the fly is coupled with the ability to correlate varying data to emulate through testing a multi-user environment. Correlation (also known as using dynamic data) is a way to ensure that the request on the current page is based on the reference (value) of the previous page. Often, the data request on the current page is based on the response data from previous pages. Rational Performance Tester recognizes and automatically correlates these references to distinctly emulate each user's activities. This way, a user is differentiated from another test user based on the distinct data requested from all of the test pages.
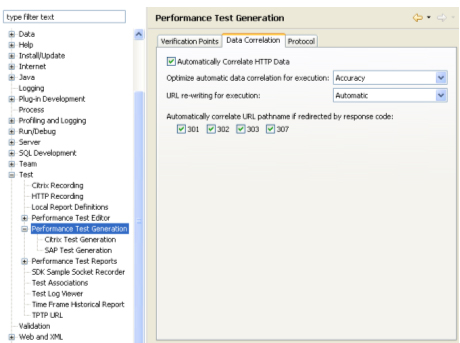
There are two ways to correlate data;
- Automatically (automated data correlation), where the test generator automatically detects the previous value to substitute in the current request. As mentioned earlier, references (value from previous responses) will be used to correlate the subsequent request value. We can also extend the correlation by using your own custom code.
-
Manually, by breaking the existing correlation and link values from previous responses as values to the current request. Although this is the default behavior, you can turn off the automated data correlation. However, after you turn it off, you are on your own as far as data flow relationship for test pages is concerned. Turning it off is easy:
- Go to...
-
Menu, Windows > Preferences > Performance Test Generation
- Select the Data Correlation tab.
- Go to...
Workload breakdown and assignment
To emulate the real-life scenario during application load testing, Rational Performance Tester gives you flexible options to make the testing as realistic as can be. We can create as many test scripts and schedules as you wish and any combination of virtual user loads, dynamically. Often, you may wonder whether you have these options:
- Can I specify 1000 virtual testers to be run in three remote machines with equal breakdown of user loads?
- Can I have 10% of the total virtual testers run first, followed by another 10% before the rest of them start?
- Can I have one group of virtual testers running certain portions of the pages within the application under test?
- Can I specify user think time?
- Can I randomize the test sequence?
- Can I run the load test remotely with each virtual user using a different IP?
- Can I run a test at a set rate?
Because Rational Performance Tester allows us to accomplish any permutation of these options, we will first explore how it allows different activities to be assigned to different groups with test elements attached to them, and how these elements affect the behavior of a load test. Figure 20 shows how easily you can break down the workload and assignments to different user groups, with each group carrying different virtual users. For example, to add a new group:
- Simply right-click on the group from a test schedule (under Schedule Contents).
- Choose the Add > user group option.
After you have created a group, you can break down the distribution among all the groups by attaching the test scripts (the recordings) to these groups.
The relationship between a user group and a test script is1:N. In other words, one user group can run more than one test script. As far as workload distribution is concerned, assigning the absolute user or percentage of users is all you have to carry out.
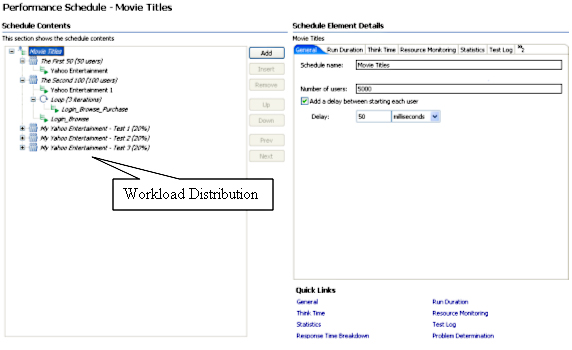
However, to emulate a real-life scenario, having just the workload distribution among various groups does not necessarily reflect a good test scenario. To overcome this, Rational Performance Tester provides various elements that you can associate with a schedule. Whether to Include these in the schedule or not depends on the scenarios that you are testing. These elements are associated directly with a schedule.
We can add these elements to a test schedule:
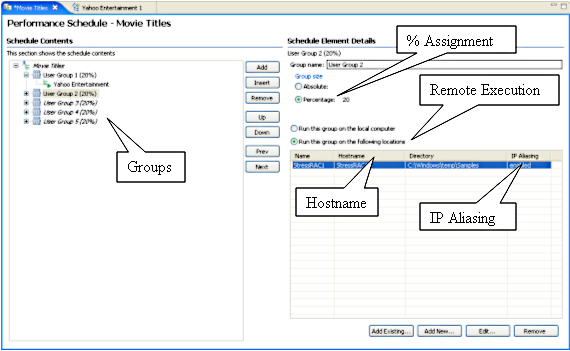
- Test script (recording): After it is recorded, you can assign a test script to a schedule. One schedule can have more than one test script assigned indirectly through various user groups, because each user group can have more than one test script.
- Group and percentage assignment: This is for a user group that breaks down the workload. It includes the ability to set the number of users that start a run. For example: 50 absolute users starting to run at time T1.
-
User think time: To emulate typical user think time, there are four options for settings;
- Recorded think time
- Fixed think time (by default, 2 seconds)
- Dynamically increasing or decreasing the think time by percentage
- Randomizing the think time by percentage.
- Delay time: We can include the delay (in ms) between user runs. Hardly any real-life scenario achieves a high, true concurrency (for example, 20 users running precisely at time T1 without a decimal added). Usually, 50-100 ms delay time is normal. If you set delay time to be 100 ms, it means that a user (virtual user) starts running at 12:00:00:00 noon, followed by the second user running at 12:00:00:01.
- Loop: This is to run a test at a set rate. From the Schedule Element Details panel, you can set the number of iterations and control the rate of iterations (for instance, 2 per sec). We can also randomize the delay between the iterations.
- Random selector: In real life, application page hit is usually random. This element is to provide randomization for a test run sequence, rather than running the test sequentially, by adding random selector. During the setting of the random selector, input for weight is required. You will subsequently associate the weight with a test script.
- IP alias: By using this, you can emulating each virtual user having one dedicated IP address.
Part 2 of this series explains these elements in more detail.
Real-time system monitoring
Reports include application tier performance monitoring, such as application server level instrumentation for...
- IBM WebSphere Application Servers (V5 or later)
- BEA WebLogic V8 or data collection
We can use the Application Response Measurement (ARM) API for application servers that aren't natively supported, such as...
- JBoss
- Apache Tomcat
The database tier monitoring can be ARM-enabled. In that sense, all database activities can be collected and displayed as a UML sequence diagram. Enabling real-life application monitoring is just one aspect of performance test monitoring. These levels of data collection (application and database tiers) are not complete without the ability to collect server-side resource level monitoring where the application components are running.
There are more than three default real-time resource level monitoring methods supported by IBM Rational Performance Tester, including these:
- IBM Tivoli Monitoring
- UNIX or Linux rstatd daemon
- Microsoft Windows Performance Monitor (perfmon)
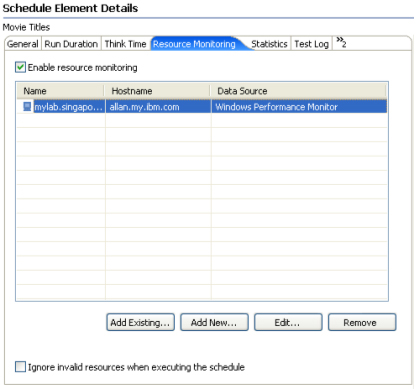
For example, to collect Windows Performance Monitor analysis data...
- Go to...
-
Schedule | Schedule Element Details | Resource Monitoring
- Check the option to Enable resource monitoring.
- For a new setup, click New
We can also add an existing server to be monitored or edit from the server defined earlier.
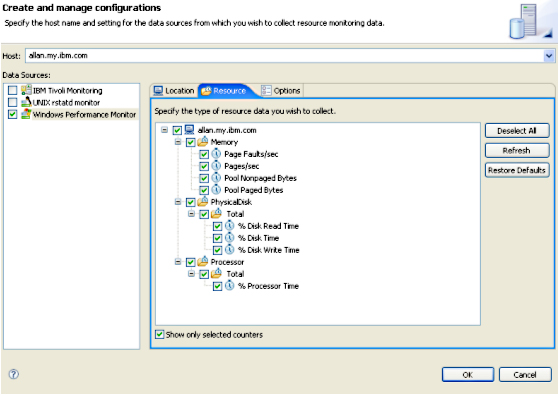
- After you click Add New, you can enter your username and password under the Location tab.
- We can then select the statistics that you want under Resource tab and polling and time-out intervals under Options tab.
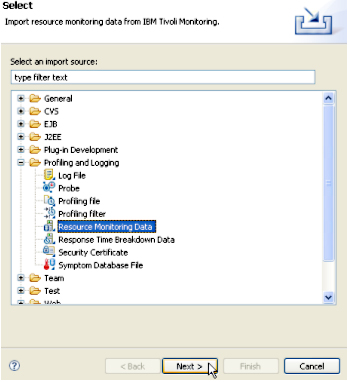
To monitor through IBM Tivoli Monitoring and UNIX (or Linux) rstatd, ensure that they are up and running. Apart from the real-time system monitoring, you can also import historical analysis data from IBM Tivoli Monitoring into a performance report. For example, from the menu, select...
-
File | Import | Profile and Logging | Resource Monitoring Data
The next screen allows us to specify the Tivoli-monitored server.
Real-time report analysis
. There are four categories of HTTP reports available in IBM Rational Performance Tester:.
- Performance Report
- Page Element Report
- Percentile Report
- Verification Report
| Performance Report | High-level reports, such as overall run success rate, a summary page that showcases the total completed users, total elapsed time, average response time for all pages, and so forth. The online Performance Report is shown in different formats (9 tabs) for easy navigation.
|
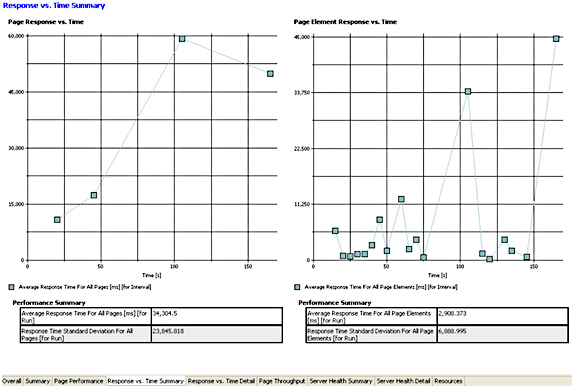
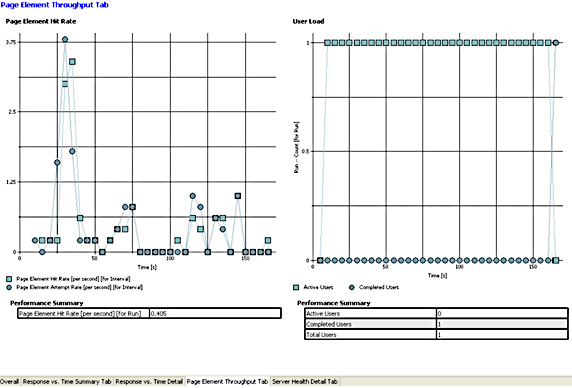
| Page Element Report | 5 tab report, consists of its own set of default analysis reports, such as Response vs. Time Details and Page Element Throughput.
|
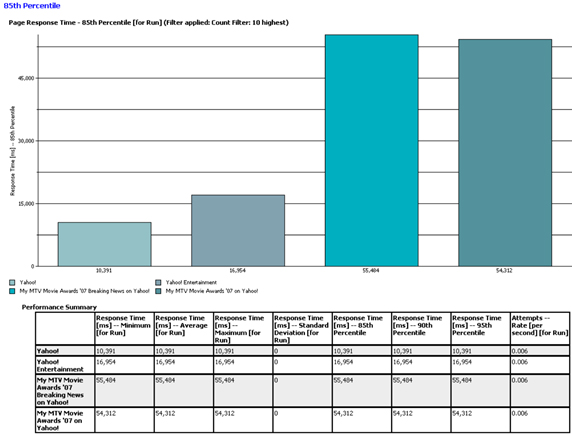
| Percentile Report | 4-tab report, shows the percentile ranking associated with page response time. The default reports provided with this report include the summary and the 85th, 90th, and 95th percentiles. This type of report is usually used to determine the anomalies, such as a surge in page activity. By associating the percentile with a page, data can be gathered at each page level to identify the page behavior at each of those key percentiles. These reports are one way to say that 85% of the pages are completed in X ms, 90% in Y ms and so on. We can create the relationship between percentiles and page response time so that it gives you the assurance that 85% of the pages were responded to in a specific time. Then, by visually comparing the reports with the subsequent Percentile Reports, you can easily tell when any anomalies occur.
Figure 27 captures the 85th percentile, and it's not uncommon for simpler pages to have the exact 90th and 95th percentile, which means things are going reasonably well. As the example shows, 85% of the users completed downloading the Yahoo! Entertainment page in 16,954 ms.
|
| Verification Report | 3-tab report, gives the Pass or Fail status for pages that are enabled for verification. Verification is set under Test Content under the test script. It is a way to tell if a page request passes or fails the test. The test metrics can be HTML page title, HTML return codem, and HTML response size (set from Windows > references > Performance Test Generation > Verification Points). Verification points can be turned on for each page.
|
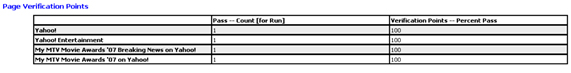
| Page Verification Points | Report lists the individual page with the corresponding passing or failing rate, plus the percentage passing rate. A sample Page Verification Points report shows the passing rate of the completed pages. In the example in Figure 29, there isn't a failed page; therefore, the passing rate is 100 percent.
|

In addition to those four reports, you can drill down to page level for better understanding of response time based on page level.
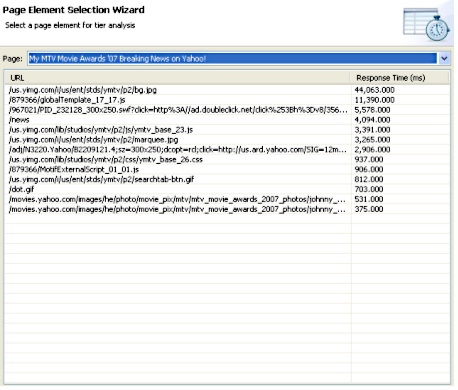
- To drill down to a page, pick a page (the vertical bar) on the Page Performance tab of the default performance report, and right-click to select Display Page Element Responses. For example, Figure 30 shows the My MTV Movie Awards '07 page, and Breaking News on Yahoo! was selected for drill-down.


Rational Performance Tester also enables us to perform root cause analysis. This is facilitated in two ways:
- resource use
- code execution statistics
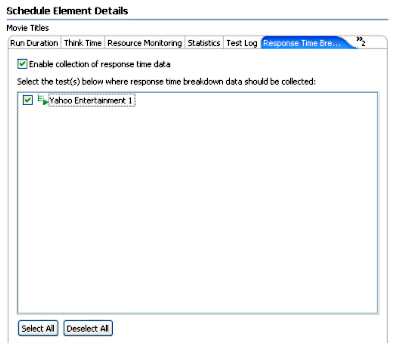
Response time breakdown shows details such as the duration of each element for the system that you are testing. Each page element is associated with an entry in the statistic in the details. To enable, choose the schedule that contains the test scripts, select...
-
Schedule Element Details | Response Time Breakdown | Quick Links | Enable collection of response time data
...and select the box for the appropriate recording.
Ensure that the DCI is running and ready to monitor.
To start monitoring, go to...
-
Start | All Programs | IBM Software Development Platform | IBM Rational Data Collection Infrastructure | Start Monitoring
The Response Time Breakdown report gives the code execution-related statistics, which include the underlying component, such as JDBC, RMI/IIOP (Remote Method Invocation over Internet InterORB Protocol), Web services, EJBs, and so forth. Figure 33 shows a sample Response Time Breakdown report. (We can also view Response Time Breakdown Statistics for more detail, although that option is not shown here.)
Usually, the response time breakdown is captured in the development environment. After it is enabled and configured to collect the amount of data (low, medium, or high), and with the data collection infrastructure installed and running, you can get collections of data in several ways:
- From a standard Web application performance test.
- From these performance monitoring tools: IBM Tivoli Monitoring for Transaction Performance, IBM Tivoli Composite Application Manager for Response Time Tracking, or IBM Tivoli Composite Application Manager for WebSphere.
- From the J2EE application server though ARM. Supported application servers are IBM WebSphere Application Server V5 and V6, and BEA WebLogic V8.
- Web Services
- From an ARM-instrumented application. This mode is to support a non-supported J2EE application server. Data can be collected by manually inserting ARM API calls. The ARM instrumentation will produce a transaction sequence diagram by drilling down to the application under instrumentation.
- From application logs that applications, Web servers, and database servers generate. These can be imported, analyzed, and correlated.
Each application server needs to be configured and instrumented to use the data collection infrastructure.
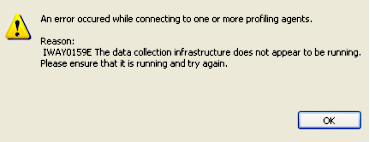
The sole purpose of starting the Data Collection Infrastructure (DCI) monitor is to collect analysis data. As mentioned earlier, to ensure that data is collected, the DCI needs to be enabled (installed and running) for each host that the application runs on and from which you want to collect data. Failure to do so will result in an error shown.
Versioning
Rational Performance Tester is packaged with IBM Rational ClearCase LT for source version control to foster better collaboration in the development environment. ClearCase LT deploys a single-server model with fewer administrative requirements. Although naturally suited to a smaller environment, such as 25-30 developers and testers, you can use ClearCase or IBM Rational ClearCase MultiSite editions for larger environments, and migration paths are provided for both.
Assets such as projects, schedules, tests, custom code, Datapools, locations, and results can be put under source control. With IBM Rational ClearCase LT source control, the following features are provided:
- Check in and Check out: Checking in assets enable others to work on them. Checking out instead allows us to work on them in your local workbench
- Perspective support: CVS Repository Exploring and Team Synchronizing perspectives.
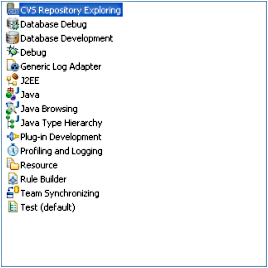
- Multiple views: CVS Console, CVS History, and CVS Repository.
-
Synchronization and Merge:
- Synchronizationis a way to inspect the differences between the local workbench resources with a repository. It allows us to update resources in your local workbench and commit resources from the local workbench to a repository.
- Merge enables us to work out a compromise when there is a resource conflict.
The integration with Rational ClearCase LT introduces the capability of sharing working assets in branches, or parallel development of assets. Anyone can share testing files by checking in and out from the work area, which can be updated at any time by team members. Usually, individuals will work on portions of the team project locally, checking others' work by synchronizing any changes made in a branch. In a nutshell, all work carried out by an individual remains local and that work will be shareable only after that person has published it by committing the work to the repository. When you have committed changes to the branch, the changes will be copied from your local workbench to the branch.
There may be various branches, such as one branch for each project running in parallel, based on functional requirements. The same applies to working with various branches. You would examine others' work by synchronizing your workbench first. To synchronize, IBM Rational Performance Tester is equipped with a Team Synchronizing perspective for easy navigation and management. There are four modes related to synchronization:
- Incoming: Shows the resources in the CVS repository that differ from local workbench (ingoing changes only)
- Outgoing: Shows resources being modified in a local workbench (outgoing changes only)
- Incoming/Outgoing: Shows the combination of both incoming and outgoing changes
- Conflict: Shows resources that are in conflict. Resources are in conflict when there is a more recent copy in the repository than the one that you are working on. Conflicting resources can be resolved by merging them. Discarding your work or others' work may not be a good option
Adding custom code and extending tests
IBM Rational Performance Tester is primarily an interactive GUI tester that enables even the novice user to perform load testing with ease. However, there is occasionally a need for more advanced testing measures that require custom code to be added.
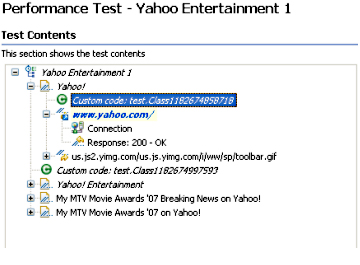
The custom code option is represented by the green character C icon. We can insert custom code anywhere within a test script. Figure 36 illustrates two custom code snippets being inserted. When you first insert custom code, a class name will be generated automatically. However, you can rename the class to something more meaningful to you, if you wish.
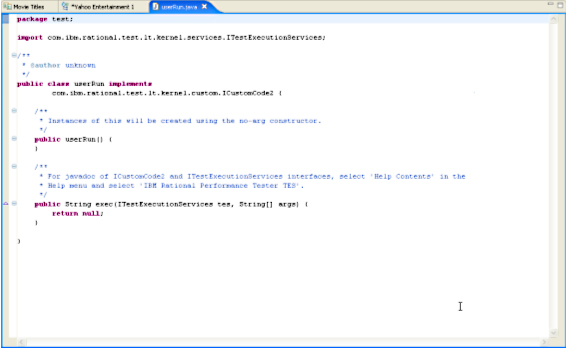
When custom code has been inserted, you can immediately enter the code logic by switching to the Java source view (click View Code). Alternatively, you can change the perspective to Java Browsing. Also, the inline Java IDE allows us to debug your code.
There are two interfaces provided, CustomCode2 and ITestExecutionServices, for us to extend test execution (a complete Javadoc is provided). The following scenarios are the typical use cases for extending test execution:
- Controlling the behavior of loops
- Running an exit to call on external program
- Finding the IP address of a group of users or an individual user
- Setting and clearing cookies for a user
- Getting information from a user data area
- Correlating data from one page to another
Scaling and maintenance
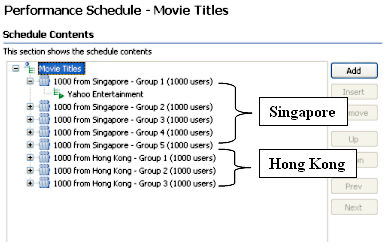
It's uncommon to test user loads dynamically for each test iteration remotely distributed across geographical boundaries. Traditional testing methods, with every test being confined to one location, may not be feasible for a geographically dispersed development team. In addition to the ability to share test assets across boundaries, Rational Performance Tester enables us to conduct the load test across different locations through a WAN (wide-area network). Because servers may be scattered, geographically, the remote execution ability coupled with the low hardware requirements needed to run the test enables us to deploy remote servers using IBM AIX, Linux, Microsoft Windows, and z/OS operating systems.
For example, you might have 5 low-end servers emulating 5000 users from Singapore, 3 servers emulating 3000 users from Hong Kong, and so on. This testing method not only produces more realistic test results, it also reduces the cost of testing overall, because test results can be analyzed and shared among the teams and idle servers can be put to good use.
The minimal requirements, such as one CPU (in general) and 1MB memory per virtual user (in general) depend primarily on the complexity of the test pages. There are factors that can increase the amount of memory per virtual user. We can achieve much higher scalability by emulating realistic scenarios, such as using think time and delay time for each user. Usually, it's a good idea not to put extra load on the administration server where central administration is being carried out, because workbench-related activities require resources from the server.
After you have captured the test script, scaling up to more virtual users is a matter of adding more user groups. Rational Performance Tester handles the scalability seamlessly by allowing us to add more user groups and assign either absolute users or users based on a percentage. There is no need to re-capture the test script as long as the test cases remains intact.
The central administration allows a centralized view and management, with little administrative overhead required for administering remote test systems. The amount of effort that it takes to administer local and remote test servers is identical, because administering remote servers is no more complicated than handling local ones. Figure 38 shows how easy it is to include remote servers as test servers.
What's next
In this first part of this four-part series, we looked at various capabilities provided by IBM Rational Performance Tester, including the easy-to-use GUI administration, reporting features, and scalability. Although this has been only a general overview, this article gave you a bird's-eye view of features and functions, We can use the knowledge gained in this brief introduction to broaden your understanding of the load-testing tools that are among the software options of the IBM Rational Software Delivery Platform.
In Parts 2 and 3, we will follow a full load-testing cycle, and in Part 4, you'll get a detailed look at the many reports and their variations included in Rational Performance Tester and learn how to customize them for your specific needs.
Resources
Learn
- Work through the Hello World tutorial by Dennis Schultz and learn how to discover and analyze performance issues using Rational Performance Tester. This tutorial includes practical, hands-on exercises that teach you how to record automated performance tests, use data-driven techniques to ensure randomization, play-back tests, and evaluate real-time performance reports. You'll need to download the free trial version ofRational Performance Tester (developerWorks, April 2007).
- Read Using IBM Rational Performance Tester: Resource monitoring Part 2, Monitoring with Windows Performance Monitor, by Ashish Patel, which describes resource monitoring using the Windows Performance Monitor (perfmon), one of the data collectors available for IBM Rational Performance Tester, including a discussion of the architecture of this data collector and how it is configured when using Performance Tester (developerWorks, May 2007).
- Enroll in RT523: Essentials of IBM Rational Performance Tester V7.0 This introductory course focuses on getting started with Rational Performance Tester and practical application of the tool to resolve common performance testing challenges. Testers can build, enhance, and run scripts in a full-function Java Integrated Development Environment (IDE) that integrates with other IBM Rational Software Delivery Platform products. This live instructor-led course takes place online, with hands-on labs and real-time interactions.
- Visit the Performance Tester area on developerWorks Rational for technical resources and best practices for using this product.
- Subscribe to the developerWorks Rational zone newsletter. Keep up with developerWorks Rational content. Every other week, you'll receive updates on the latest technical resources and best practices for the Rational Software Delivery Platform.
- Browse the technology bookstore for books on these and other technical topics.
Get products and technologies
- Evaluate Rational software with a downloadable and online version of Performance Tester trial software..
Discuss
- Check out developerWorks blogs and get involved in the developerWorks community.