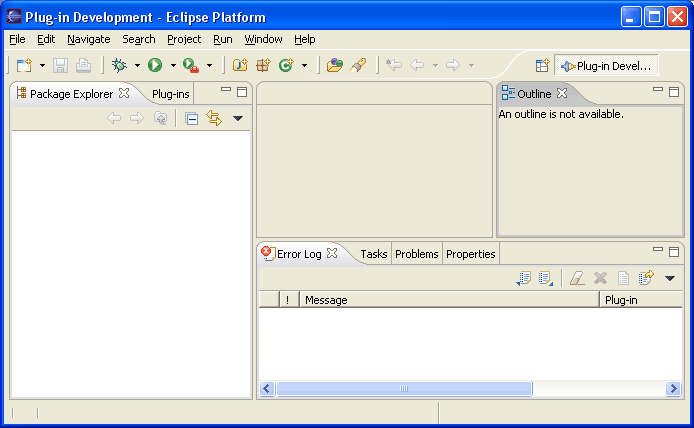
Preparing the workbench
While you can access the PDE platform contributions from any perspective, the PDE perspective is arguably the best.
From the default Resource perspective, open the PDE perspective via Window > Open Perspective > Other... and choose Plug-in Development from the offered list.

In addition to the main views and toolbar actions that are useful for Java development, the PDE perspective adds shortcuts to very frequently used wizards such as the New Plug-in Project creation wizard, etc. It also adds views that are very important to a plug-in developer including the Error Log view.
Error Log
The Error Log view captures all internal warnings and errors thrown by the platform and by your code. These errors are written to a .log file that is located in the .metadata subdirectory of your workspace, and the Error Log view shows the content of this file with a variety of convenient options such as filtering, sorting, etc.
By default, once the Error Log view is in your workspace, it will be brought to the front upon the logging of new events. This feature can be turned on/off in the drop down menu of the view.
Other features of the log view include the ability to import any arbitrary log file into the view, and to export the log contents into a file.
