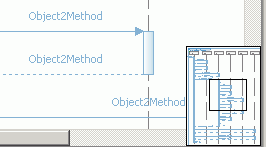
 button at the right-hand corner of the view. The sequence diagram overview is displayed.
The visualization of host and process interactions in the Sequence Diagram views of the Profiling and Logging Perspective helps in workload administration of distributed applications. The representation of time in these views helps in determining bottlenecks in application performance as well as network communication.
Prerequisites:
The sequence diagram views provide a number of actions that can be performed to easily view interactions.
To open a sequence diagram interaction view,...
Please go to Monitoring levels and corresponding views to see which interaction diagrams are available for a selected monitoring levels.
For large views where scrolling is required, the overview can be used to navigate to
and from different pages within the sequence diagram.
To open the sequence diagram overview, click on the
 button at the right-hand corner of the view. The sequence diagram overview is displayed.

For views with multiple pages, there are several methods of navigation available.
 Go to next page and
 Go to previous page buttons.
Collapsing and expanding lifelines can be used to hide or expand sections of data within a view.
 .
.
Note: Object or Class Interactions only
Collapsing and expanding messages can be used to hide or show all method calls invoked from a selected method.
 .
.
Note: Object or Class Interactions only
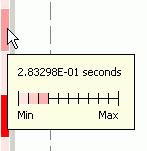
The relative amount of time spent between two consecutive method calls or returns can be viewed by hovering the mouse over the timeline on the left-hand side of the diagram.
 .
.
To return the view to the default display size (reset zoom factor), to zoom in, or to zoom out, use this set of toolbar controls.
 .
.
Related concepts
Overview of the Log Analyzer
Log file correlation
Log interactions view
Log thread interactions view
Related tasks
Working with log files
Synchronizing time
Related reference
Monitoring levels and corresponding views
Sequence Diagram controls
Lifeline categories