Tutorial: Analyzing the profiling data from a Java process
Objectives
To analyze the data collected from profiling a Java process, using the
Profiling and Logging views of the Profiling and Logging perspective in the following ways:
- Identify objects and methods that consume the most time
- Identify memory-intensive classes
- Gauge program concurrency
- Locate memory leaks
- Browse every execution of a method as a function of time
- Get a wider view of execution behavior as a function of time
- Identify active threads
- Identify when threads are active
- Identify frequently called methods
- Gauge garbage collection
- Identify different phases of program execution
- Study different method invocations
- Study the caller of a method
Time required
1 hour
Before you begin
Before you start this tutorial, you need to:
- Install the Eclipse Platform, including the Hyades tools.
- Have the sample profiling files ready for import. They should be in:
Hyades_install_dir\eclipse\plugins\org.eclipse.hyades.collection.framework_3.0.0\src\org\eclipse\hyades\test\collection\framework
Description
In this tutorial, you will use the different Profiling and Logging views to analyze the
sample PerformanceExample.class. The sample opens a frame containing two buttons.
You will complete the following tasks:
- Opening the Profiling and Logging Perspective in the
workbench
- Profiling the PerformanceExample class
- Analyzing the profiling information
To update the views while the application is being monitored, click the Refresh Views button
 .
.
Click Open a Perspective
 > Other > Profiling and Logging
To profile the PerformanceExample class,...
- Click on the Profile
 drop-down,
and select Profile. The Launch Profile dialog opens.
- Double click on External Java Application to create a new configuration.
- Switch to the Main tab.
- Type org.eclipse.hyades.test.collection.framework.PerformanceExample into the Class name
field.
- Click Add Jar to add the jar that contains this class.
- Select Hyades_install_dir\eclipse\plugins\org.eclipse.hyades.collection.framework\hcframe.jar
.
- Click Open. The jar is added.
- Click on the Profiling tab. You can specify the profiling criteria in this tab.
- Click on the Overview tab. You can specify the filter sets and content in this tab.
- Click on the Add button to create a new profiling set.
- Type the name for this profiling set, and click OK. A new
profiling set has been added to the list of available profiling sets, and it is checked as being the profiling set to be used.
- To add contents to your profiling set, click on the Edit button to bring up the Edit Profiling Set wizard.
- Expand the node labelled Memory Analysis, select Memory/Leak Analysis and check the checkbox beside it. This will add
memory related information to the list of information types that should be collected from the application.
- Expand the node labelled Time Analysis, select Execution Time Analysis and check the checkbox beside it.
With this option selected you can use the statistical views to analyze time related information. You need to collect execution graphical
details to be able to use the Execution Flow and Method Invocation views. Since the purpose of this sample is to guide you through all the
profiling views, including Execution Flow and Method Invocation views, select Show execution flow graphical details.
Click Next.
- This page provides the ability to specify the subset of information you would like to analyze. This is useful if you wish to filter out
classes or packages that are not within the bounds of what you would like to analyze.
Under Contents of selected filter set, click Add to add packages that you want to collect data for.
The Add Filter dialog opens up.
- To profile this package, type org.eclipse.hyades.test.collection.framework.* as the Package or Class.
- Specify the Method Name as PerformanceExample to include only methods related to this example.
- Click OK. The filter criterion is added to the contents list.
- To exclude other existing packages from the filter contents list, click on Include under
the Rule column for the package, and change it to Exclude.
- Click Finish.
- Click on the Limits tab. This tab controls the amount of data that is collected,
either based on elapsed time or the number of method invocations. Accept the defaults.
- Click on the Destination tab. ProfileProject and Default Monitor are the default
profiling resources and they can be used to store data from this profiling session.
- Click Run.
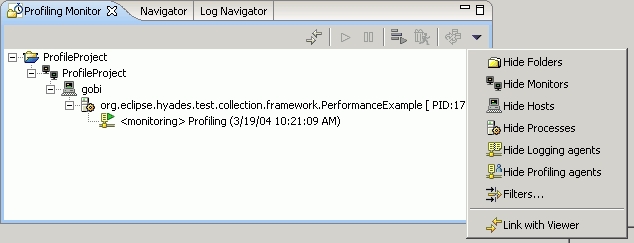
- The required profiling resources are created and the agent and process appears in the Profiling Monitor view.
- Enable the viewing of Folders, Monitors, and Hosts and you see the
monitor that groups your data as well as the machine on which you are running
the workbench.
View execution behavior over a period of time
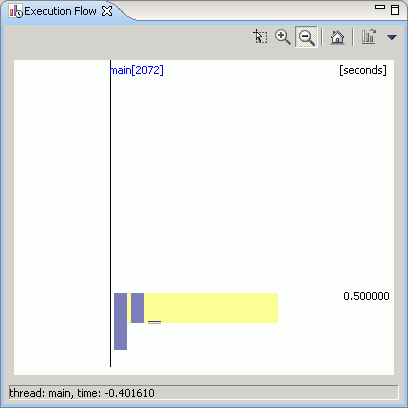
You can examine the execution of the application using the Execution Flow view.
The execution of the entire program is represented in this view. It
shows time on the vertical axis.
- In the Profiling Monitor view,s elect your monitor, right-click and select Open With > Execution Flow to
open the Execution Flow view. The Execution Flow view opens.
- To examine a particular method, click a method name (or the white space below it) to select it. All its
called methods are then highlighted in yellow. The vertical length of
the highlighted area is an indication of the base time for the method. The
exact value for the base time is displayed in the status line.
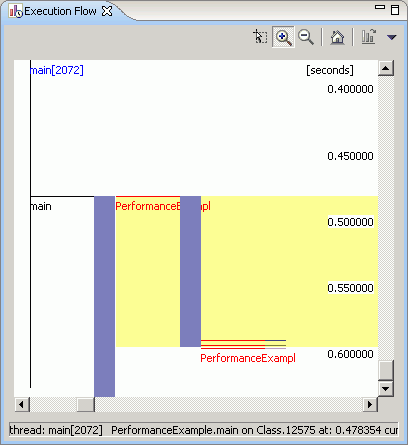
- Use the Zoom In tool
 to enable the cursor,
then point and click to enlarge an area.
Note: To update the views while the application is being
monitored, click the Refresh Views button
 .
.
Identifying active threads
In the Execution Flow view, each thread contains periods of
activity, which are identified by a profusion of method calls. In symbolic
representation, the first called method is a stripe, and methods that it
subsequently calls appear as other stripes to its right. The sequence of method
calls progresses from left to right; the active parts of the thread are
identified by this left-to-right progression.
When you select the whole section outlining the sequence of method calls,
the base time that is spent executing that sequence is displayed in the status
line. To see the base time for which the thread is active, find the difference
between the following times:
- Point to the top horizontal line of the selected yellow area to display
the corresponding base time in the status line.
- Similarly, point to the bottom edge of the yellow selected area (which
covers the period of execution when the method sequence is in action), and
view the base time at that point.
Tips
- If the graph is too crowded and difficult to read, zoom in
 to the crowded area.
- When you select a method all its called methods are highlighted in
yellow.
- You can drag and drop the views on the workbench, arranging them
simultaneously if needed.
- Wherever you point the cursor the corresponding base time is indicated in
the status bar.
- To reset the display of the view, click
the Home button.
Identifying frequently called methods
To identify frequently called methods:
- Use the Zoom tool
 to enlarge a sequence of method calls.
- Look for stripes of the same color within the selected area. These
stripes identify methods from the same class instance that have been called
multiple times.
- Check the length of the stripes of different color (each of which
represents a method). The longer the stripe, the longer the execution time of
that method.
Gauging garbage collection
Normally, it is impossible to tell that garbage collection has occurred for
an object by inspecting stripes in a user thread in this view.
Follow these steps:
- Check the column furthest to the left in this view. This column is
reserved for the garbage collection thread, and is called the GC thread
column.
- Check if there is a single, thin rectangle in the GC thread column. The
rectangle will probably be located well down from most method calls on the
object. This rectangle appears in the GC thread column whenever garbage
collection has occurred for an object.
Identifying phases of program execution
Identifying the initialization phase
- Use the Zoom In tool
 to enlarge the sequence of method calls at the top
of the main thread.
- Note the methods that are marked -init-
- Click to select such a method. The status bar is
updated to indicate that the method helps in initialization
(assigning of values to variables used in the application).
Analyzing methods using the Method Invocation view
- From the Profiling Monitor, select either a monitor or an agent. Right
click, then select Open With > Execution Flow. The Execution
Flow view appears.
- Select the method you want to study, right-click, then select
Show Method Invocation.
- Use the Zoom In tool
 to enlarge a section of the display. The stripes are
color-coded by class and are connected by horizontal lines that represent
method calls.
- Select a method by clicking on its name.
- Click the Refresh Views button
 to ensure
that you are viewing current information.
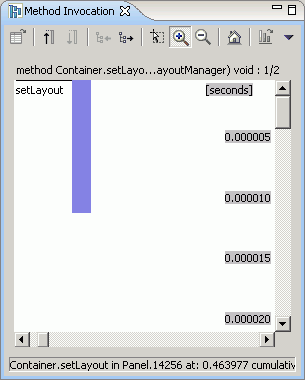
- Note the line:

This line displays the name of the method, followed by n/m, where
n is the invocation that is currently displayed out of a total of its
m invocations.
- Click Previous
 and
Next
 to
browse all invocations of the selected method (or each message to the
selected object). The fraction on the toolbar changes to indicate which
invocation you are viewing.
Finding the caller of a method
To find what is calling a method, following these steps, continuing on in
the Method Invocation view:
- To view the caller of the method, click the Show Caller button
 . The method is displayed
along with its caller to the left of it.
- To view more details about the caller of the method for each new
invocation that you view, positioning the cursor over the stripe that
represents the caller in the view. The status line displays the caller's
information.
- To see the method that a selected method calls, click the Show Called
Method button
 .
.
![]() .
.![]() > Other > Profiling and Logging
> Other > Profiling and Logging![]() drop-down,
and select Profile. The Launch Profile dialog opens.
drop-down,
and select Profile. The Launch Profile dialog opens.


![]() to enable the cursor,
then point and click to enlarge an area.
to enable the cursor,
then point and click to enlarge an area.

![]() .
.![]() to the crowded area.
to the crowded area.
![]() to enlarge a sequence of method calls.
to enlarge a sequence of method calls.

![]() to enlarge the sequence of method calls at the top
of the main thread.
to enlarge the sequence of method calls at the top
of the main thread.
![]() to enlarge a section of the display. The stripes are
color-coded by class and are connected by horizontal lines that represent
method calls.
to enlarge a section of the display. The stripes are
color-coded by class and are connected by horizontal lines that represent
method calls.
![]() to ensure
that you are viewing current information.
to ensure
that you are viewing current information.
![]()
![]() and
Next
and
Next
![]() to
browse all invocations of the selected method (or each message to the
selected object). The fraction on the toolbar changes to indicate which
invocation you are viewing.
to
browse all invocations of the selected method (or each message to the
selected object). The fraction on the toolbar changes to indicate which
invocation you are viewing.![]() . The method is displayed
along with its caller to the left of it.
. The method is displayed
along with its caller to the left of it.
![]() .
.