Overview of the Profiling Tool
The Profiling Tool consists of the Profiling and Logging Perspective and a number of views. It enables you to profile your applications, to work with profiling resources, to interact with the applications you are profiling, and to examine your applications for performance and memory usage problems. The Profiling Tool collects data related to the Java program's run-time behavior and presents this data in both graphical and tabular views. All these facilities help you to visualize and understand your program execution as well as to explore patterns of program behavior.
The Profiling Tool also enables you to pinpoint the operations that take the most time, and helps you to easily identify repetitive execution behavior and to eliminate redundancy. In short, the Profiling Tool is broadly useful for performance analysis and for gaining a deeper understanding of your Java program.
Profiling enables you to test your application's performance early enough in the programming development cycle that there is sufficient time to make improvements and to test them.
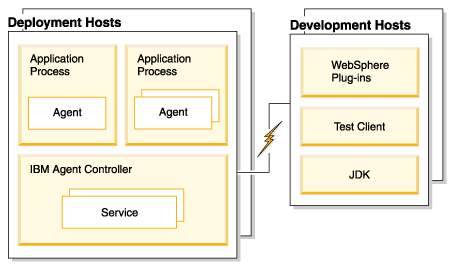
Profiling architecture
The Java Profiling Agent is an agent instance that is deployed with the Agent Controller. In the deployment diagram below, the Agent may be a Java Profiling Agent. The Application Process is the Java Virtual Machine that executes the Java application.

Each application process being profiled may have a profiling agent running within it. Thus, the Profiling Tool makes it possible to interactively profile these applications from a single workbench.
Features
Some features of the Profiling Tool are:
Visual information display
Conventional performance tools that are based on the procedural programming model miss important information about the behavior of Java programs, which are object-oriented. In contrast, the Profiling Tool is able to model and present your program's execution in a way that is consistent with the object-oriented model, thereby retaining all relevant information.
By selecting a resource, you can look at the aggregated profiling data. For example, the monitor resource displays data for all the hosts and agents defined under that monitor.
Pattern extraction
Pattern extraction takes a mass of execution information and reduces it to a fundamental form, giving you an overall view of the execution of a program, with the choice of viewing more detail about object and method calls. Pattern extraction greatly simplifies run-time analysis. The Profiling Tool has powerful pattern extraction capabilities. .
Distributed monitoring
The tools give you the ability to concurrently monitor many processes on many machines, thereby profiling a distributed application. Using the Agent Controller, the Profiling Tool has the ability to launch applications on remote machines and to then interactively profile them. This is useful when trying to determine the performance characteristics of your applications when they are running on their deployment target platform.
Related concepts
Profiling resources
The Symptom Database
Common Base Event model
Related tasks
Setting
profiling preferences
Specifying profiling criteria
Profiling an application
Saving
profiling data to an external file
Saving
profiling resources
Importing profiling resources
Related references
Profiling console view
Profiling monitor view
Sequence diagram views
Statistical views