Creating a performance monitoring agent - Perfmon Launch Configuration
To launch a new Perfmon Agent using
the Profiling Launch Configurations:
- Make sure you have a
Project in your workspace to hold the trace data/
- Switch to the profiling perspective
using Window > Open Perspective > Other > Profiling and
Logging/
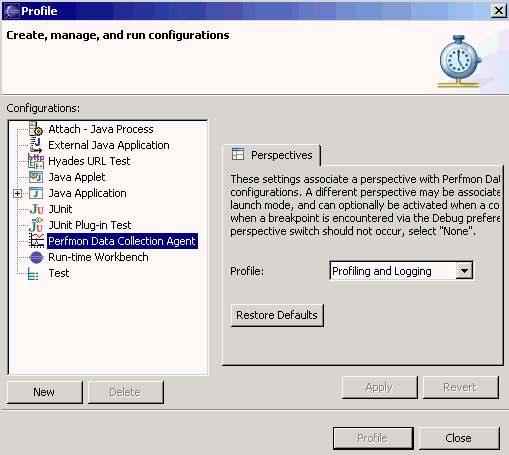
- Open the Launch
Configurations dialog using Run > Profile.

- Right-click on Perfmon Data Collection Agent and select New.

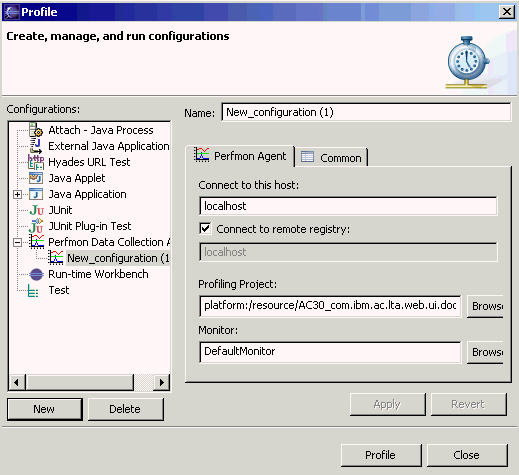
- Specify a name for the configuration in the Name field.
- Select the Project you want to store the trace data in using the Browse button next to the Profiling Project field.
- Select the monitor you want to use for your trace using the Browse button next to the Monitor field.
- Specify the host to be used in the Connect to this host field. The Agent Controller must
be running on the machine specified.
Note:If the performance objects are required for the machine on which Hyades is actually running (i.e.
localhost), you do not need to change any information in the dialog box.
- If the performance objects from a remote machine are required, select Connect to remote registry
and type the name or IP address of the remote machine in the field below. Note: use the
Perfmon format for specifying the remote machine, i.e. preceed the host
name or IP address with double backslashes, e.g.
\\192.168.1.23 or \\smithy.
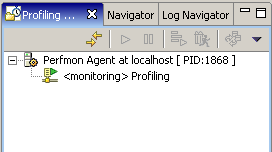
- The Profiling Monitor
view will open and after a short while you will see the agent appear

- To configure the Perfmon counters
you wish to trace, right click on the agent node select Configure
Perfmon Counters. A counter configuration dialog will appear.
Prerequisite(s)
Monitoring
Performance Counters
Related concepts
Monitoring
and Analyzing Performance Counters
Related tasks
Observing Data in the
Statistical View
Related reference
Statistical Console graphs and
tables
(C) Copyright Scapa Technologies
Limited. 2003-2004. All Rights Reserved.
