JBoss 7.1+ / Wildfly 8.x - 9.x
Configuration
Management User
To access the JBoss monitoring API, a management user must be created. The user login and password are then required on connecting the monitor in NeoLoad. The user must be added to the ManagementRealm through the add-user command-line program in the JBOSS_HOME/bin folder.
For more information about adding a management user, see the JBoss documentation.
Remote Access
To monitor a JBoss server, this user must be able to access it from a remote machine. In the server configuration, it is necessary to update the XML configuration file of the JBoss server available in <JBoss>/standalone/configuration/
For example, <any-address/> makes it possible to monitor the JBoss server from any remote machine:
<interfaces>
<interface name="management">
<!-- inet-address value="${jboss.bind.address.management:127.0.0.1}"/-->
<any-address/>
</interface>
<interface name="public">
<any-address/>
</interface>
<interface name="unsecure">
<!--inet-address value="${jboss.bind.address.unsecure:127.0.0.1}"/-->
<any-address/>
</interface>
</interfaces>
EJB3 Metrics
To enable EJB3 monitoring metrics for JBoss 7.2, it is necessary to run jboss-cli.bat and execute the command lines:
- connect
- /subsystem=ejb3:write-attribute(name=enable-statistics,value=true)
Supported versions
JBoss 7.1.x and 7.2.x in standalone and domain modes are supported.
Depending on the JBoss version used, NeoLoad displays only the counters that are supported.
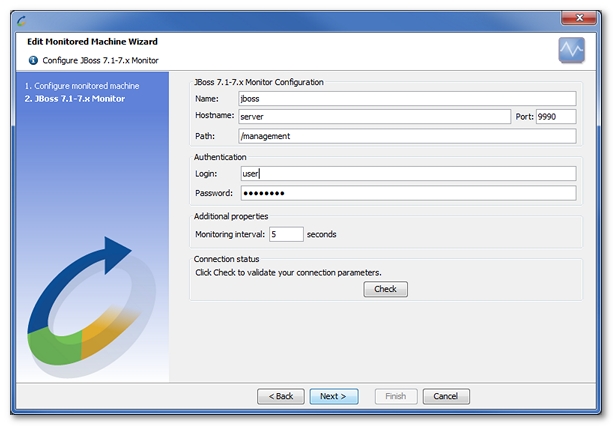
Create a JBoss monitor
NeoLoad makes it possible to create a new monitor either using the monitored machine creation wizard, as described in Create and configure a monitored machine, or from an existing monitored machine, as described in Create and configure a monitor:
- In standalone mode, a JBoss 7.1 or Jboss 7.2 server can be monitored with the /management path.

- In domain mode, there are multiple servers and each individual server can be monitored with a server-specific path. For example /management/host/master/server/server-two makes it possible to monitor the "server-two" machine and /management/host/master/server/server-one to monitor "server-one".

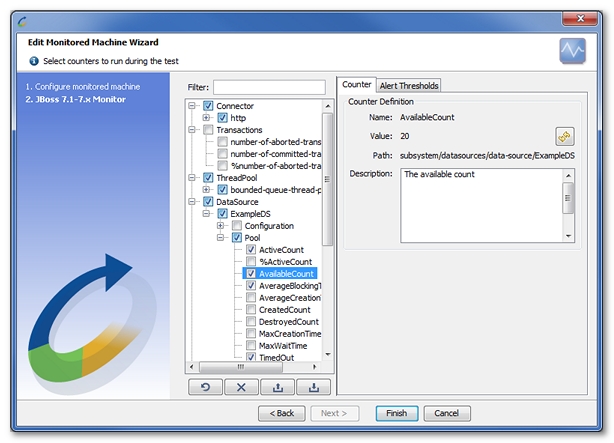
NeoLoad displays a list of the EARs (Enterprise Archive) and WARs (Web Application archive) deployed on the configured server. It then automatically selects the most appropriate counters for each of the selected applications.

Available counters
Depending on the JBoss version used, NeoLoad displays only the counters that are supported.

All JBoss counters are documented here:
- Connector
- bytesReceived: Number of bytes received by the connector (POST data) since the last call.
- bytesSent: Number of bytes sent by the connector since the last call.
errorCount: Number of errors that occur when processing requests by the connector since the last call.
- maxTime: Max time spent to process a request.
- max-connections: Amount of concurrent connections that can be processed by the connector with optimum performance. The default value depends on the connector used.
- %errorCount: Percent of errors that occur when processing requests by the connector since the last call.
- processingTime: Processing time used by the connector since the last call. In milli-seconds.
- requestCount: Number of requests processed by the connector since the last call.
- Transactions
- number-of-aborted-transactions: Number of aborted (i.e. rolled back) transactions since the last call.
- number-of-committed-transactions: Number of committed transactions since the last call.
- %number-of-aborted-transactions: Percent of aborted (i.e. rolled back) transactions.
- ThreadPool
- unbounded-queue-thread-pool
- active-count: Number of active threads
- %active-count: Current threads divided by the max threads.
- current-thread-count: Current number of threads in the pool.
- max-threads: Maximum thread pool size.
- scheduled-thread-pool
- active-count: Number of active threads
- %active-count: Current threads divided by the max threads.
- current-thread-count: Current number of threads in the pool.
- max-threads: Maximum thread pool size.
- blocking-bounded-queue-thread-pool
- current-thread-count: Current number of threads in the pool.
- %current-thread-count: Percent number of current threads
- max-threads: Maximum thread pool size.
- blocking-queueless-thread-pool
- current-thread-count: Current number of threads in the pool.
- %current-thread-count: Percent number of current threads
- max-threads: Maximum thread pool size.
- bounded-queue-thread-pool
- current-thread-count: Current number of threads in the pool.
- %current-thread-count: Percent number of current threads
- max-threads: Maximum thread pool size.
- queueless-thread-pool
- current-thread-count: Current number of threads in the pool.
- %current-thread-count: Percent number of current threads
- max-threads: Maximum thread pool size.
- unbounded-queue-thread-pool
- DataSource
- Configuration
- Configuration: DataSource pool min, max pool size and wait timeout configuration.
- Pool
- ActiveCount: Active count.
- %ActiveCount: Percent of active count.
- AvailableCount: Available count.
- AverageBlockingTime: Average time spent blocking for a connection.
- AverageCreationTime: Average time spent creating a physical connection.
- CreatedCount: Created count since the last call.
- DestroyedCount: Destroyed count.
- MaxCreationTime: Maximum time for creating a physical connection.
- MaxWaitTime: Maximum wait time for a connection.
- TimedOut: Timed out count.
- Configuration
- JMS Servers
- Queue
- consumer-count: Number of consumers consuming messages from this queue.
- delivering-count: Number of messages that this queue is currently delivering to its consumers.
- message-count: Number of messages currently in this queue.
- scheduled-count: Number of scheduled messages in this queue.
- Topic
- delivering-count: Number of messages that this queue is currently delivering to its consumers.
- durable-message-count: Number of messages for all durable subscribers for this topic.
- message-count: Number of messages currently in this queue.
- non-durable-message-count: Number of messages for all non-durable subscribers for this topic.
- non-durable-subscription-count: Number of non-durable subscribers for this topic.
- subscription-count: Number of (durable and non-durable) subscribers for this topic.
- Queue
- JCA
- long-running-threads
- core-threads: Core thread pool size which is smaller than the maximum pool size. If undefined, the core thread pool size is the same as the maximum thread pool size.
- current-thread-count: Current number of threads in the pool.
- %current-thread-count: Percent of current number of threads in the pool
- max-threads: Maximum thread pool size.
- rejected-count: Number of tasks that have been passed to the handoff-executor (if one is specified) or discarded, since the last call.
- short-running-threads
- core-threads: Core thread pool size which is smaller than the maximum pool size. If undefined, the core thread pool size is the same as the maximum thread pool size.
- current-thread-count: Current number of threads in the pool.
- %current-thread-count: Percent of current number of threads in the pool
- max-threads: Maximum thread pool size.
- rejected-count: Number of tasks that have been passed to the handoff-executor (if one is specified) or discarded, since the last call.
- long-running-threads
- VM
- Heap
- heap-memory-usage.max: Maximum amount of memory in bytes that can be used for memory management.
- heap-memory-usage.used: Amount of used memory in bytes.
- %heap-memory-usage.used: Percent of heap used memory.
- Non Heap
- non-heap-memory-usage.max: Maximum amount of memory in bytes that can be used for memory management.
- non-heap-memory-usage.used: Amount of used memory in bytes.
- %non-heap-memory-usage.used: Percent of non-heap used memory.
- Garbage Collector
- collection-count: Number of collections that have occurred since the last call.
- collection-time: Approximate accumulated collection elapsed time in milliseconds since the last call.
- Threads
- daemon-thread-count: Current number of live daemon threads.
- thread-count: Current number of live threads including both daemon and non-daemon threads.
- total-started-thread-count: Total number of threads created and also started since the Java virtual machine started.
- Heap
- Description
- System
- available-processors: Number of available processors.
- operating-system: Operating system name, version and architecture.
- JVM
- JVM: Java Virtual Machine information.
- Environment
- server-name: Server hostname.
- Server
- Jboss: JBoss server name and version.
- System
- Deployment
- War / Sessions
- active-sessions: Number of active sessions.
- expired-sessions: Number of expired sessions.
- %expired-sessions: Percent number of expired sessions.
- max-active-sessions: Max number of concurrent active sessions.
- rejected-sessions: Number of rejected sessions.
- %rejected-sessions: Percent number of rejected sessions.
- session-avg-alive-time: Average time (in seconds) that expired sessions had been alive.
- sessions-created: Total sessions created.
- War / EJB3
- execution-time: Time spent within a bean method.
- invocations: Number of invocations processed.
- peak-concurrent-invocations: Peak concurrent invocations.
- wait-time: Time spent waiting to obtain an instance.
- Ear / War / Sessions
- active-sessions: Number of active sessions.
- expired-sessions: Number of expired sessions.
- %expired-sessions: Percent number of expired sessions.
- max-active-sessions: Max number of concurrent active sessions.
- rejected-sessions: Number of rejected sessions.
- %rejected-sessions: Percent number of rejected sessions.
- session-avg-alive-time: Average time (in seconds) that expired sessions had been alive.
- sessions-created: Total sessions created.
- Ear / War / EJB3
- execution-time: Time spent within a bean method.
- invocations: Number of invocations processed.
- peak-concurrent-invocations: Peak concurrent invocations.
- wait-time: Time spent waiting to obtain an instance.
- War / Sessions