Define NeoLoad Trend Graphs
By default, two NeoLoad trend graphs are displayed:
- Average Response Time (all pages)
- Error Rate %
You can also define as many customized graphs as you want from your NeoLoad project. Each graph can display several curves.
- To add a custom graph
- Select the job where you want to execute a NeoLoad scenario and click Configure.
- In the Build section, go to Define NeoLoad Trend Graphs subsection.
- Click Add Graph.
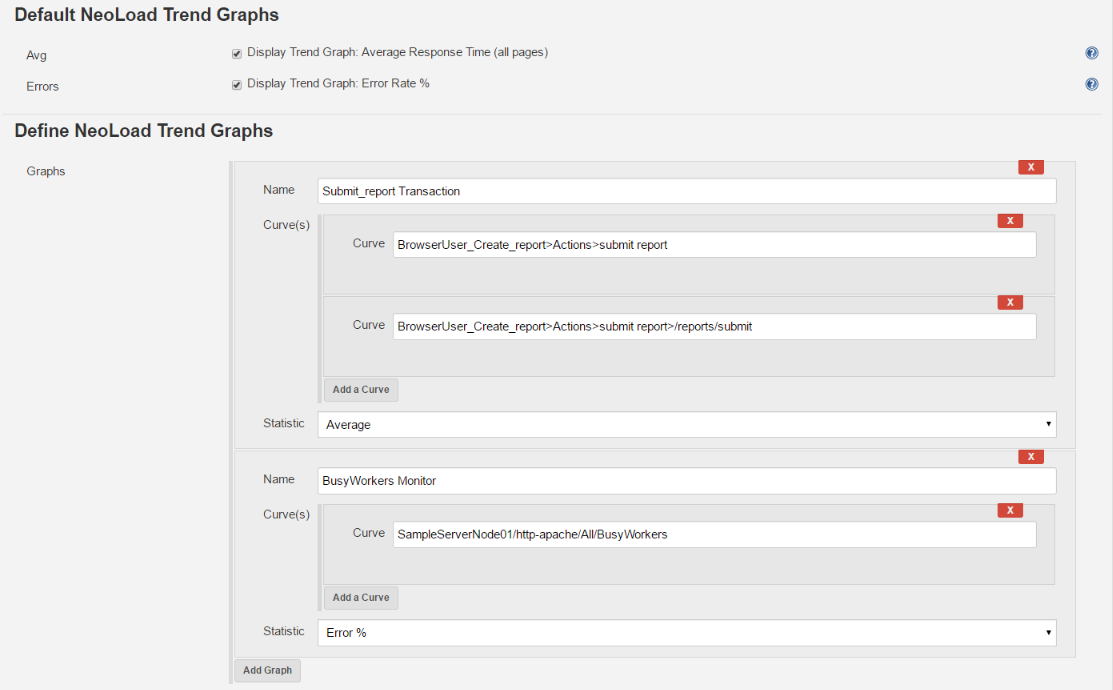
- In the newly created step, enter the information required to define a custom graph:
- Enter a name to identify the graph.
- In the Curve(s) field, the way to define a curve depends on what you want to display:
- Recorded actions: UserPath>Actions>Transaction>Page (Use the > character to separate elements)
- Monitors: SampleServerNode01/http-apache/All/BusyWorkers (Use the / character to separate elements)
- Load Generators: LG <hostname>:<port number>/Memory Used (Use the / character to separate elements)
- Select the statistic you want to apply on each curve of the graph.