SAP NetWeaver 7.0.x
Supported versions
NeoLoad supports SAP net weaver Web Application Server versions 7.0.x and later.
Configuration
Before the SAP net weaver monitor can be used, several net weaver server jars need to be installed.
Copy the following files from the net weaver installation directory to the <neoload>/jmxlib/netweaver70 directory:
- <netweaver>/<instance>/<java server>/j2ee/admin/lib/admin.jar
- <netweaver>/<instance>/<java server>/j2ee/admin/lib/com_sap_pj_jmx.jar
- <netweaver>/<instance>/<java server>/j2ee/JSPM/lib/exception.jar
- <netweaver>/<instance>/<java server>/j2ee/JSPM/lib/logging.jar
After copying the files, it is unnecessary to restart NeoLoad. The files are automatically synchronized with the Monitoring Agent once the changes have been made.
Connection settings
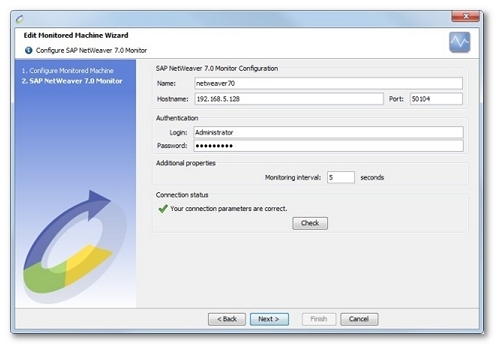
Defining a monitor on a SAP net weaver server requires the name or IP address of the machine to be monitored, as well as the connection port. The port is the SAP NetWeaver server access point for the P4 protocol. The port number can be retrieved using the SAP Management Console at: Management Console > SAP Systems > <SAP System name> > <SAP Instance name> > Access Points. The access point is named P4.
In addition to these settings, a valid user account must be provided if authentication is enabled (same account as the one used to connect to the SAP net weaver Administration Console).
Create an SAP NetWeaver monitor
NeoLoad makes it possible to create a new monitor either using the monitored machine creation wizard, as described in Create and configure a monitored machine, or from an existing monitored machine, as described in Create and configure a monitor.

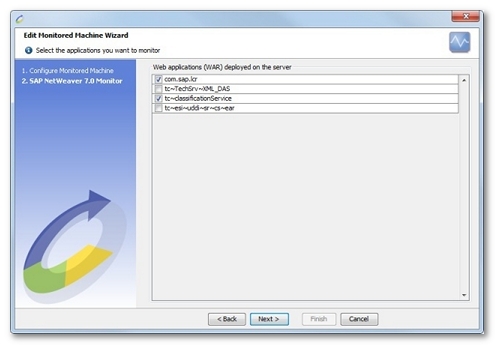
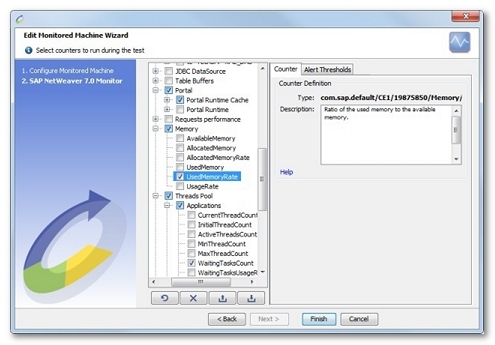
NeoLoad displays a list of the applications deployed on the configured server. It then automatically selects the most appropriate counters for each of the selected applications.

Available counters

All SAP net weaver counters are documented here.
The first-level nodes in the monitors tree show the domain (only for 7.1.x versions), the instance name and the cluster node number respectively.
- Connections. Counters on all the connections of the SAP net weaver server.
- ConnectionsUsageRate. Connections used, of all types, as a percentage of maximum number of connections.
- FreeConnectionsInPool. Number of free connections in the pool.
- HTTPConnectionsCount. Number of HTTP connections to the server.
- IIOPConnectionsCount. Number of IIOP connections to the server.
- JMSConnectionsCount. Number of JMS connections to the server.
- MaxPossibleConnections. Maximum number of simultaneous connections to the server.
- OtherConnectionsCount. Number of connections to the server other than HTTP, IIOP, JMS, P4 or Telnet.
- P4ConnectionsCount. Number of P4 connections to the server.
- TELNETConnectionsCount. Number of Telnet connections to the server.
- TotalConnectionsCount. Total number of connections to the server, of all types.
- Sessions. This section allows monitoring the server sessions.
- HTTP. Server HTTP session Monitors.
- TotalResponseTime. Current response time for all responses.
- AllResponsesCount. Number of all responses.
- AllRequestsCount. Number of all requests.
- CurrentHttpSessions. Number of currently valid HTTP sessions.
- TimedOutHttpSessions. Number of sessions that have timed out.
- HttpSessionsInvalidatedByApplication. Number of HTTP sessions invalidated by the application.
- CurrentSecuritySessions. Number of currently valid security sessions created for HTTP clients.
- TimedOutSecuritySessions. Number of security sessions that have timed out.
- SecuritySessionsInvalidatedByApplication. Number of security sessions that have been invalidated by the application.
- Security. Server security sessions.
- InvalidSessionsCount. Number of invalid security sessions.
- LoggedOffSessionsCount. Number of all security sessions for which the user has successfully logged off.
- TimedOutSessionsCount. Number of all security sessions that have timed out.
- LoggedUsersCount. Number of logged-in users.
- TotalSessionsCount. Number of all security sessions.
- UserStoreAccessCount. Number of store accesses made by a user.
- ActiveSessionsCount. Number of all active security sessions. Such sessions can be created for every protocol that has access to the server: HTTP, P4, IIOP, Telnet, and RFC.
- UnsuccessfullLogonAttempsCount. Number of all unsuccessful logon attempts.
- Session Manager. Session counters for the server resources as a whole.
- Active Web Sessions Count. Number of active Web sessions.
- Logged-In Users Count. Number of logged-in users.
- Opened EJB Sessions Count. Number of opened EJB sessions.
- Opened Security Sessions Count. Number of opened security sessions.
- Opened Web Sessions Count. Number of opened Web sessions.
- HTTP. Server HTTP session Monitors.
- Transactions. Counters for the server transactions as a whole.
- ActiveTransactionsCount. Number of active transactions.
- TimeoutedTransactionsCount. Number of transactions that have timed out
- SuspendedTransactionsCount. Number of suspended transactions
- CommittedTransactionsCount. Number of transactions that have been committed
- OpenTransactionsCount. Number of running transactions.
- RolledBackTransactionsCount. Number of transactions that have been rolled back
- TransactionSuccessRate. Ratio between committed transactions count and total transactions count.
- EJB. Counters for EJBs deployed on the net weaver server. The EJBs are categorized by type (Entity Bean, Message Driven Bean, Session Stateful Bean or Session Stateless Bean) and sorted by EAR.
- ActivationsNumber. Number of times a bean instance has been activated.
- CreationsNumber. Number of times a bean has been created.
- CurrentPoolSize. Number of bean instances provided by this pool, which are currently used by the application or are stored in the pool.
- InitialPoolSize. Initial number of bean instances created in the pool.
- LoadsNumber. Number of times a bean instance has been loaded.
- MaxPoolSize. Maximum number of bean instances the pool can hold.
- PassivationsNumber. Number of times a bean instance has been passivated.
- PoolCurrentlyUsedObject. Number of bean instances provided by the pool currently used.
- PoolIncrementSize. Number by which the bean pool will be incremented.
- RemovalsNumber. Number of times a bean has been removed.
- StoresNumber. Number of times a bean has been saved.
- HTTP Channel. Counters for the HTTP access point.
- ThreadsInProcessRate. Ratio between the number of active threads count and the total size of the pool.
- TotalResponseTime. Current response time for all responses.
- ActiveThreadsCount. Number of threads from the thread pool that are executing a runnable task.
- ResponseFromCacheCount. Number of responses served from the cache.
- ThreadPoolSize. Current number of threads created by the thread pool.
- AllResponsesCount. Number of all responses.
- AllRequestsCount. Number of all requests.
- JDBC DataSource. Provides data source connection pool information for each data source.
- Free managed connections number. Number of free ManagedConnections for the specified data source.
- Maximum connections number. Maximum number of ManagedConnections simultaneously opened from a specific data source.
- Used managed connections number. Number of used ManagedConnections.
- Waiting for connections number. Number of clients waiting for pooled ManagedConnection.
- Portal. Information on SAP portal activity.
- Portal Runtime Cache. Counters for portal cache access.
- Fail Count. Number of failed cache accesses.
- Hit Count. Number of requests served by the cache.
- Load Count. Number of responses loaded by the cache.
- Miss Count. Number of responses that failed to be handled by the cache.
- Read Count. Number of responses read by the cache.
- Write Count. Number of responses written to the cache.
- Portal Runtime.
- Loaded Applications. Number of applications loaded by the portal.
- Loaded Component Contexts. Number of component contexts loaded by the portal.
- Loaded Component. Number of components loaded by the portal.
- Loaded Services. Number of services loaded by the portal.
- Portal Runtime Cache. Counters for portal cache access.
- Request Performance. Counters for JARM (Java Application Response Time Measurement) performance requests.
- Average CPU time. Average CPU time for JARM requests.
- Average outbound data. Average outbound data for JARM requests.
- Average response time. Average response time of JARM requests.
- Component calls. Number of component calls by all JARM requests.
- Number of requests. Number of JARM requests.
- Requests per second. Number of JARM requests per second.
- Memory. Counters for SAP net weaver server memory.
- AvailableMemory. Current value of the available memory.
- AllocatedMemory. Current value of the allocated memory.
- AllocatedMemoryRate. Ratio of allocated memory to the available memory.
- UsedMemory. Current value of the memory used.
- UsedMemoryRate. Ratio of the used memory to the available memory.
- UsageRate. Ratio between the used memory and the total memory of the process.
- Thread Pool. Thread pool counters. These counters are divided between application threads and system thread.
- CurrentThreadCount. Current number of threads created by the thread pool.
- InitialThreadCount. Initial size of the thread pool.
- ActiveThreadsCount. Number of threads from the thread pool that are executing an executable task pool. It shows how many threads from the thread pool are currently processing custom tasks. This Monitor does not indicate a problem.
The number of used threads depends on the number of configured threads and the value of the maximum pool size, and whether this size is reached or whether the pool can still be resized. Even if the pool is resized to maximum and the value of ActiveThreadsCount and CurrentThreadCount are the same, this does not indicate a problem. The purpose of the threads pool is to restrict the request load to a point where the engine can still have enough resources to process these parallel requests fast enough. - MinThreadCount. Minimum size of the thread pool.
- MaxThreadCount. Maximum size of the thread pool.
- WaitingTasksCount. The number of tasks waiting to be executed by a free thread.
WaitingTasksCount shows the number of custom tasks that are waiting to be processed, which means that at the moment there are no free threads in the thread pool although the thread pool is resized to its maximum size. In this case, the tasks that are waiting to be processed start accumulating in a queue. Even when the load is high, the threads process a custom task for a certain time and take the next task from the queue. When the size of the queue grows, it mean that either the request rate is growing and the server node cannot handle such a high load, or there is a blocking situation in the server and the threads are not released from the tasks they are currently executing.
The Monitor is important to detect how effectively the threading system executes the tasks. With 100% usage rate, caller threads are blocked until some of the tasks that are currently executing finish. This could be a symptom of a deadlock or a bottleneck. - WaitingTasksUsageRate. The ratio of the current size of the waiting tasks queue to the maximum configured size. WaitingTasksUsageRate shows the percentage of the waiting tasks queue that is currently used.
The ratio shows how effectively the threading system executes the tasks. When the usage is 100%, the caller threads are blocked until any of the currently executing tasks finishes. This can be a symptom for a deadlock or bottleneck. - WaitingTasksQueueOverflow. The number of threads waiting to deposit a task in the waiting tasks queue when the queue is full.
WaitingTasksQueueOverflow shows the number of blocked threads waiting to submit a task in the queue of waiting tasks. In this situation there are no free threads to process requests and also the size of the queue of waiting tasks is full, so the threads that need to submit a new task in this queue are blocked until a free slot is available. This Monitor shows a problem.
This counter is unlikely to change its value from 0 because it means that the capacity of the requests queue is exhausted. This is a severe performance problem. This can also be a symptom for a locking situation (blocking back-end calls or Java level deadlock). - MaxWaitingTasksQueueSize. Capacity of the waiting tasks queue, where tasks waiting for execution are stored.
- ThreadPoolCapacityRate. The ratio of the current thread pool size to the maximum pool size in percentages. ThreadPoolCapacityRate shows the percentage of the maximum pool size that the thread pool has currently reached. This is an informative Monitor that does not indicate a problem.
If the percentage is high, it means that soon the ability to resize the pool will be exhausted. If the ThreadPoolUsageRate is also high, a requests queue will be formed. - ThreadPoolUsageRate. Ratio of active threads count to maximum pool size. The outcome is presented as a percentage.
- UsageRate. Ratio between active threads count to maximum pool size in percent.
- Configuration. Configuration of the Threads pool.
- Description. Information concerning the SAP net weaver server.
- Version. Version of the SAP net weaver server.