JOnAS monitor
Supported versions
NeoLoad supports all Jonas server versions marked as certified Java Enterprise Edition (J2EE).
Connection settings
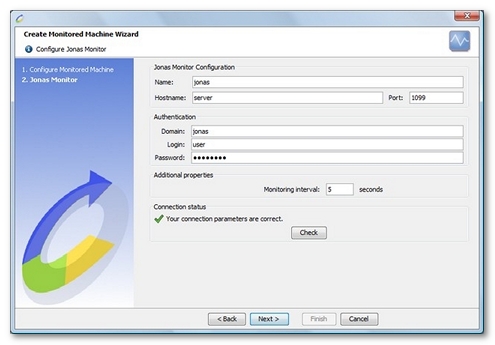
Defining a monitor to a Jonas server requires the name or IP address of the machine to be monitored, as well as the connection port (the default port is 1099). The port is the Jonas server RMI connection port.
In addition to these settings, a valid user account must be provided if authentication is enabled (same account than the one used to connect to Jonas Administration Console). By default authentication is not enabled.
Create a JOnAS monitor
NeoLoad makes it possible to create a new monitor either using the monitored machine creation wizard, as described in Create and configure a monitored machine, or from an existing monitored machine, as described in Create and configure a monitor.

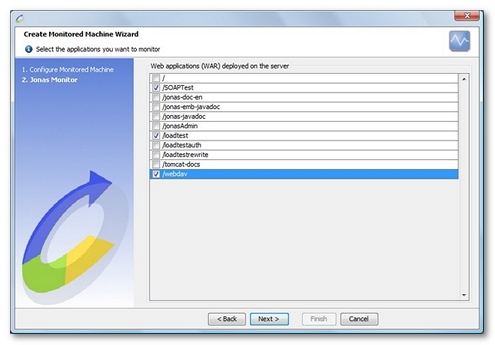
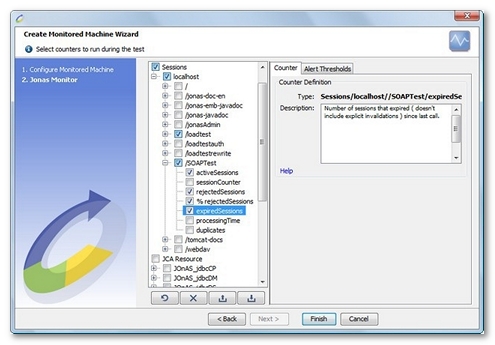
NeoLoad displays a list of the EARs (Enterprise Archive) and WARs (Web Application archive) deployed on the configured server. It then automatically selects the most appropriate counters for each of the selected applications.

Available counters

All Jonas counters are documented here. Depending on the Jonas version, some counters may be automatically hidden because they are not supported by this particular Jonas version.
- Servlet. This section allows monitoring each servlets by application.
- loadTime. Servlet load time.
- classLoadTime. Servlet class load time.
- processingTime. Total execution time of the servlet service method.
- requestCount. Number of requests processed by this wrapper since last call.
- errorCount. Error count since last call.
- % errorCount. Percentage of errors since last call.
- Sessions. This section allows monitoring the sessions for each application:
- Tomcat.
- activeSessions. Number of active sessions at this moment.
- sessionCounter. Number of sessions created by this manager since last call.
- rejectedSessions. Number of sessions rejected since last call due to maxActive being reached.
- % rejectedSessions. Percentage of sessions rejected since last call due to maxActive being reached.
- expiredSessions. Number of sessions that expired (does not include explicit invalidations) since last call.
- processingTime. Time spent doing housekeeping and expiration.
- duplicates. Number of duplicated session ids generated.
- Jetty.
- connections. Total number of connections.
- connectionsOpen. Number of opened connections.
- connectionsOpenMax. Maximum number of opened connections.
- connectionsDurationAve. Average duration of a connection.
- connectionsRequestsAve. Average number of requests of a connection.
- errors. Number of errors since last call.
- requests. Number of requests since last call.
- requestsActive. Number of active requests since last call.
- requestsDurationAve. Average duration of a request.
- Tomcat.
- JCA Resource. This section allows monitoring JCA server resources.
- connectionFailures. Number of connection failures.
- connectionLeaks. Number of connection leaks. A connection leak is an unused connection which has not been released.
- currentBusy. Number of busy connections.
- currentOpened. Number of opened connections.
- currentWaiters. Current number of connection waiters.
- rejectedFull. Number of open calls that were rejected because too many waiters
- rejectedOpen. Total number of open calls that were rejected.
- rejectedOther. Number of open calls that were rejected by an unknown reason.
- rejectedTimeout. Number of open calls that were rejected by timeout.
- waitingTime. Total waiting time (millisecond) since data source creation.
- JMS.
- Topic. A JMS Topic allows management of the message flow from publisher to subscribers. The following counters are shown for each JMS topic.
- nbMsgsReceiveSinceCreation. Number of received messages since last call.
- nbMsgsSendToDMQSinceCreation. Number of queued messages since last call.
- nbMsgsDeliverSinceCreation. Number of delivered messages since last call.
- Queue. The following counters are presented for each JMS queue.
- PendingMessages. Number of pending messages.
- PendingRequests. Number of pending requests.
- nbMsgsReceiveSinceCreation. Number of received messages since last call.
- nbMsgsSendToDMQSinceCreation. Number of queued messages since last call.
- nbMsgsDeliverSinceCreation. Number of delivered messages since last call.
- Topic. A JMS Topic allows management of the message flow from publisher to subscribers. The following counters are shown for each JMS topic.
- Server Proxy. This section allows monitoring the state of each servers of the domain.
- ConnectionFailuresJCAConnection. Number of connection failures to a JCA resource.
- ConnectionLeaksJCAConnection. Number of connection leaks to a JCA resource. A connection leak is an unused connection which has not been released.
- CurrentBusyJCAConnection. Number of busy JCA connection.
- CurrentOpenedJCAConnection. Number of opened JCA connection.
- ConnectionFailuresJDBCResource. Number of connection failures to a JDBC resource.
- ConnectionLeaksJDBCResource. Number of connection leaks to a JDBC resource. A connection leak is an unused connection which has not been released.
- CurrentBusyJDBCResource. Number of busy JDBC connection.
- CurrentOpenedJDBCResource. Number of opened JDBC connection.
- CurrentNumberOfEJB. Number of EJB.
- CurrentNumberOfEntityBean. Number of EntityBean
- CurrentNumberOfMDB. Number of MDB.
- CurrentNumberOfSBF. Number of SBF.
- CurrentNumberOfSBL. Number of SBL.
- AllThreadsCount. Number of threads.
- CurrentTotalMemory. Total size of the memory.
- CurrentUsedMemory. Current used memory size.
- CurrentWorkerPoolSize. Current worker pool size.
- DataSource. Provides data source connection pool information for each data source.
- connectionFailures. Number of connection failures to the data source.
- connectionLeaks. Number of connection leaks to the data source. A connection leak is an unused connection which has not been released.
- currentBusy. Number of connections currently in use.
- busyMax. Maximum number of connections currently in use.
- jdbcMaxConnPool. Maximum number of connections to the data source.
- currentOpened. Number of opened connections to the data source.
- servedOpen. Number of accepted connections since last call.
- currentWaiters. Number of threads waiting for the data source.
- jdbcMaxWaiters. Maximum number of threads waiting for the data source.
- rejectedFull. Number of rejected connections.
- rejectedOpen. Number of rejected opened connections.
- rejectedOther. Number of rejected connections for an unknown reason.
- rejectedTimeout. Number of rejected connections due to a timeout.
- waitingTime. Current waiting time for the data source to be available.
- configuration. Textual description of data source pool configuration.
- Transactions. Monitors transactions for the whole server.
- totalBegunTransactions. Number of begun transactions since last call.
- totalCommittedTransactions. Number of committed transactions since last call.
- totalCurrentTransactions. Number of active transactions.
- totalExpiredTransactions. Number of expired transactions since last call.
- totalRolledbackTransactions. Number of transactions that have been rolled back since last call.
- EJB. Monitors invocation counts for each EJB. Counters are separated in two categories:
Warning: Those counters are only available since 4.8.x version server.
- StatelessSessionBean.
- poolSize. Pool size.
- cacheSize. Number of instances in cache.
- maxCacheSize. Maximum number of instances in cache.
- StatefulSessionBean.
- poolSize. Pool size.
- cacheSize. Number of instances in cache.
- maxCacheSize. Maximum number of instances in cache.
- EntityBean.
- poolSize. Pool size.
- cacheSize. Number of instances in cache.
- maxCacheSize. Maximum number of instances in cache.
- StatelessSessionBean.
- Description. Information concerning the applications server configuration.
- Server.
- Version. Server version.
- currentTotalMemory. Total memory that the server can use.
- currentUsedMemory. Current memory usage.
- % currentUsedMemory. Percentage of current memory usage.
- JVM.
- Version. JVM version.
- allThreadsCount. Threads count started by the JVM.
- Server.