AIX
Supported versions
The AIX monitor has been validated on AIX versions 5, 6.1, 7 and 7.1.
Connection settings
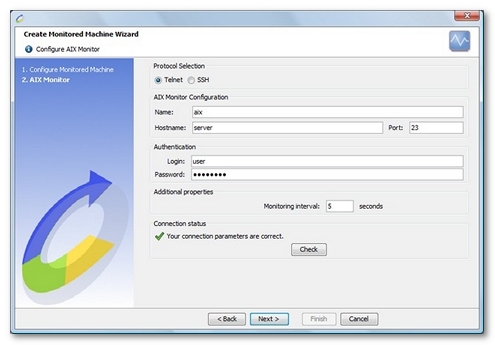
When creating a new monitor of this type, the protocol must be specified (Telnet or SSH).
Defining an AIX connection to a server requires the name or IP address of the machine to be monitored, as well as the connection port. The standard access ports are port 23 for the Telnet protocol and port 22 for the SSH protocol.
A valid user account also must be entered to allow NeoLoad to connect to the server and retrieve the performance counters to be monitored. NeoLoad can open up to three Telnet/SSH connections to the server, depending on the counters to be monitored.
- Warning: With some configurations, repeated connections to the server using the same account (e.g. root account) may not be possible. If this is the case, and depending on the counters selected, certain counters may not function.
Specificities of the SSH protocol
NeoLoad supports the following authentication methods: login / password, private key / public key and Keyboard-Interactive.
On certain systems, the authentication must be configured in the SSH configuration file. If the connection parameters are correct, and the authentication fails, check the SSH configuration in the file /etc/ssh/sshd_config. Check to make sure that one of the following parameters has the value yes: PasswordAuthentication, PubkeyAuthentication or PAMAuthenticationViaKbdInt. The SSH service needs to be restarted for any change to take effect.
NeoLoad also supports the following encryption algorithms (ciphers): aes128-cbc, aes128-ctr, aes192-cbc, aes256-cbc, 3des-cbc, 3des-ctr, blowfish-cbc, arcfour, arcfour128, twofish-cbc, twofish128-cbc, twofish192-cbc, twofish256-cbc, and cast128-cbc.
- Warning: The use of encryption algorithms in certain states may be subject to restrictions.
Lastly, NeoLoad supports the following message authentication codes (MAC): hmac-sha1, hmac-sha1-96, hmac-md5, and hmac-md5-96.
Create an AIX monitor
NeoLoad makes it possible to create a new Monitor either using the monitored machine creation wizard, as described in Create and configure a monitored machine, or from an existing monitored machine, as described in Create and configure a monitor.

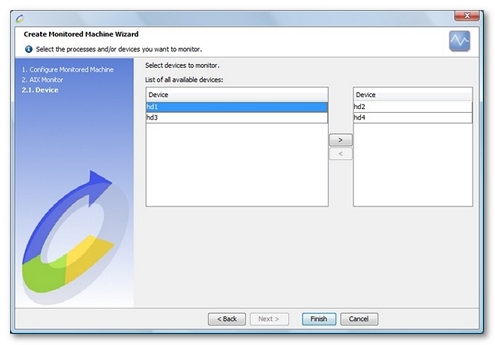
Depending on the type of counter selected, NeoLoad displays additional steps to select the hard disks (Disk (per device) category counter) to be monitored.

Available counters

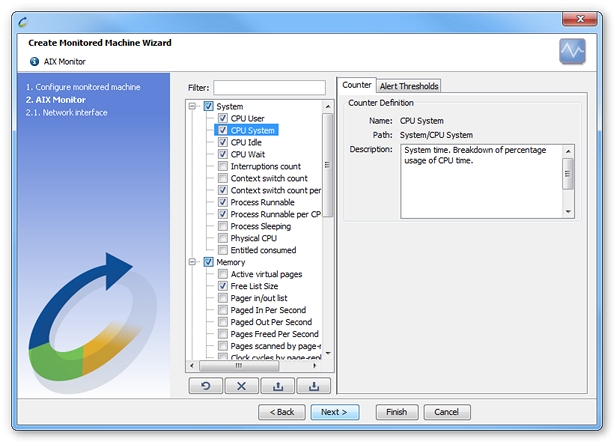
The counters available on AIX operating system are listed here.
- System.
- CPU User. User time. Breakdown of percentage usage of CPU time.
- CPU System. System time. Breakdown of percentage usage of CPU time.
- CPU Idle. CPU idle time. Breakdown of percentage usage of CPU time.
- CPU Wait. CPU cycles to determine that the current process is waiting and there is pending disk input/output.
- Interruptions Count. Device interrupts. Trap and interrupt rate averages per second over the sampling interval.
- Context Switch Count. Kernel thread context switches. Trap and interrupt rate averages per second over the sampling interval.
- Context Switch Count per CPU. Kernel thread context switches per CPU. Trap and interrupt rate averages per second over the sampling interval.
- Processes Runnable. Average number of runnable kernel threads over the sampling interval. Runnable refers to threads that are ready but waiting to run and to those threads already running.
- Processes Runnable per CPU. Average number of runnable kernel threads over the sampling interval per CPU.
- Processes Sleeping. Average number of kernel threads placed in the VMM wait queue (awaiting resource, awaiting input/output) over the sampling interval.
- Physical CPU. Number of physical processors consumed. Only available if the partition is running with shared processor. (only available on micro-partitioned environments).
- Entitled consumed. The percentage of entitled capacity consumed. Only available if the partition is running with shared processor. (Only available on micro-partitioned environments).
- Memory.
- Active virtual pages. Active virtual pages.
Information: Virtual pages are considered active if they have been accessed. A page is 4096 bytes.
- Free List Size. Size of the free list.
- Pager in/out list. Pager input/output list. Average pages per second over the interval.
- Paged In Per Second. Pages paged in from paging space. Average pages per second over the interval.
- Paged Out Per Second. Pages paged out to paging space. Average pages per second over the interval.
- Freed Per Second. Pages freed (page replacement). Average pages per second over the interval.
- Pages Scanned by page-replacement. Pages scanned by page-replacement algorithm. Average pages per second over the interval.
- Clock cycles page-replacement. Clock cycles by page-replacement algorithm. Average clock cycles per second over the interval.
- Active virtual pages. Active virtual pages.
- Disk. The disk section counters are available per device. Outside the wizard, select the device in the counter definition pane. A device picker is available using the Fill devices button. All the Disk counters need the iostat command installed on the server system. This command is a part of the sysstat package. Please make sure that this command is available before using those counters.
- Data transferred (read/write). Indicates the amount of data transferred (read or written) per second to the drive. Different suffixes are used to represent the unit of transfer. Default is in bytes per second.
- Transfers per second. Indicates the number of transfers per second that were issued to the physical disk. A transfer is an I/O request to the physical disk. Multiple logical requests can be combined into a single I/O request to the disk. A transfer is of indeterminate size.
- Read transfers per second. Indicates the number of read transfers per second.
- Write transfers per second. Indicates the number of write transfers per second.
- Data read per second. Indicates the amount of data read per second, from the drive. Different suffixes are used to represent the unit of transfer. Default is in bytes per second.
- Data written per second. Indicates the amount of data written per second, to the drive. Different suffixes are used to represent the unit of transfer. Default is in bytes per second.
- Disk activity (percent). Indicates the percentage of time the physical disk was active (bandwidth utilization for the drive).
- Network (per interface). The network section counters are available per interface. Outside the wizard, select the interface name in the counter definition pane. A network interface picker is available by clicking on the Populate button.
- Incoming bytes/s. The number of bytes received by the network interface per second.
- Incoming packets/s. The number of packets received by the network interface per second.
- Incoming packet errors/s. The number of broken packets received by the network interface per second.
- % Incoming packet errors. Percentage of broken packets received by the network interface (% Incoming packet errors = Incoming packet errors / Incoming packets *100).
- Outgoing bytes/s. The number of bytes issued by the network interface per second.
- Outgoing packets/s. The number of packets issued by the network interface per second.
- Outgoing packets errors/s. The number of broken packets issued by the network interface per second.
- % Outgoing packet errors. Percentage of packets issued by the network interface and considered broken (% Outgoing packet errors = Outgoing packet errors / Outgoing packets *100).
- Packet collisions. The number of packet collisions discovered by the network interface.
- TCP.
- Incoming segments/s. The number of TCP segments received per second.
- Segments completely duplicated/s. The number of duplicated segments received per second. A segment is duplicated when it is received many times after one or more retransmissions.
- % Segments duplicated. Percentage of duplicated segments received (% Segments duplicated = Segments completely duplicated / Incoming segments * 100).
- Outgoing segments/s. The number of TCP segments transmitted per second.
- Data segments retransmitted/s. The number of data segments retransmitted per second. A segment is retransmitted when the acknowledgment receipt timeout is expired or when an error is discovered.
- % Segments retransmitted. Percentage of retransmitted segments (% Segments retransmitted = Segments retransmitted / Outgoing segments *100).
- Retransmit timeouts. The number of timeout triggers for segment retransmissions.