Presentation
- operating systems
- network components
- database servers
- web servers
- application servers
Server monitoring is done using a Monitoring Agent. The Controller has its own default Monitoring Agent but others may be installed on different machines for security purposes.
For more information, click the image below to see the Neotys video about monitoring:
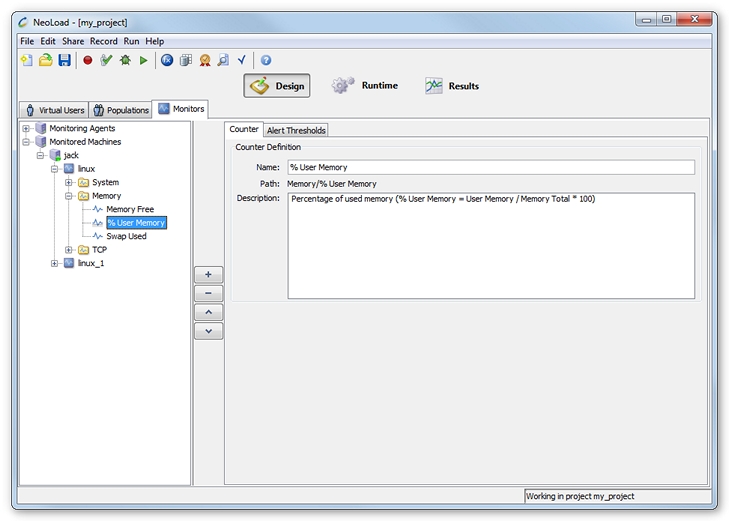
The monitored machines can be accessed from the Monitors tab in the Design section.
The Monitors tab displays the monitored machines in a tree view. Under each monitored machine, several monitors can be defined for each type of system being monitored. Several performance counters and indicators can be defined for each of these monitors. These counters (numeric values) and indicators (text values) are grouped by category. Several alert thresholds may be set for each performance counter above which an alert will be triggered during the test. By default, NeoLoad automatically selects the most relevant counters and indicators when the monitor is configured and sets the corresponding thresholds.
Available monitors depend on your licence edition.
A performance counter, represented by the ![]() icon, corresponds to a numeric value that varies during the test. The
icon, corresponds to a numeric value that varies during the test. The ![]() icon indicates a performance counter for which alert thresholds have been set.
icon indicates a performance counter for which alert thresholds have been set.
A performance indicator, represented by the ![]() icon, corresponds to a text content, across several lines, that does not vary during the test. Depending on the type of indicator, this content is retrieved from the monitored system either:
icon, corresponds to a text content, across several lines, that does not vary during the test. Depending on the type of indicator, this content is retrieved from the monitored system either:
- at the start of the test: for example, the JDBC pool configuration
- at the end of the test: for example, the most resource-hungry SQL requests

The Monitors tab tree makes it possible to:
- move items in the tree
- delete items from the tree
- cut, copy and paste items in the tree
