Request metrics is a tool that enables you to track individual transactions, recording the processing time in each of the major WebSphere Application Server components.
The information that is tracked by request metrics might either be saved to log files for later retrieval and analysis, be sent to
Application Response Measurement (ARM) agents, or both.As a transaction
flows through the system, request metrics includes additional information so that the log records from each component can be correlated, building up a complete picture of that transaction. The result looks similar to the following example:
HTTP request/trade/scenario ------------------------------> 172 ms Servlet/trade/scenario -----------------------------> 130 ms EJB TradeEJB.getAccountData ---------------------> 38 ms JDBC select --------------------------------> 7 ms

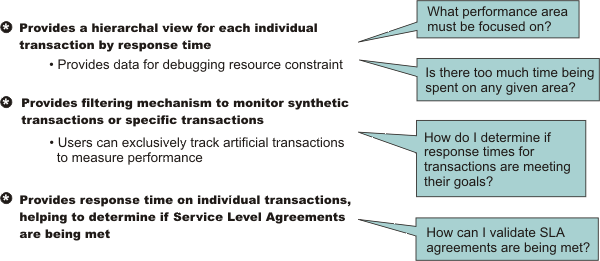
This transaction flow with associated response times can help you target performance problem areas and debug resource constraint problems. For example, the flow can help determine if a transaction spends most of its time in the Web server plug-in, the Web container, the EJB container or the back end database. The response time that is collected for each level includes the time spent at that level and the time spent in the lower levels. For example, the response time for the servlet, which is 130 milliseconds, also includes 38 milliseconds from the enterprise beans and Java Database Connectivity. Therefore, 92 ms can be attributed to the servlet process.
Request metrics tracks the response time for a particular transaction. Because request metrics tracks individual transactions, using it imposes some performance implications on the system. However, this function can be mitigated by the use of the request filtering capabilities.
For example, tools can inject synthetic transactions.
Request metrics can then track the response time within the WebSphere Application Server environment for those transactions. A synthetic transaction is one that is injected into the system by administrators to take a proactive approach to testing the performance of the system. This information helps administrators tune the performance of the Web site and take corrective actions. Therefore,
the information that is provided by request metrics might be used as an alert mechanism to detect when the performance of a particular request type goes beyond acceptable thresholds. The filtering mechanism within request metrics might be used to focus on the specific synthetic transactions and can help optimize performance in this scenario.
About this task
When you have the isolated problem areas, use request metrics filtering mechanism to focus specifically on those areas. For example, when you have an isolated problem in a particular servlet or EJB method, use the uniform resource identifier (URI) algorithms or EJB filter to enable the instrumentation only for the servlet or EJB method. This filtering mechanism supports a more focused performance analysis. Five types of filters are supported:
When filtering is enabled, only requests that match the filter generate request metrics data, create log records, call the ARM interfaces,
or all. You can inject the work into a running system (specifically to generate
trace information) to evaluate the performance of specific types of requests in the context of a normal load, ignoring requests from other sources that might be hitting the system.
Note: Filters are only applicable where the request first enters WebSphere Application Server.
Procedure
Related reference
Example: Using request metrics
Searchable topic ID: tprf_requestmetrics