This topic describes the Performance Monitoring Infrastructure (PMI) data classification.
PMI provides server-side data collection and client-side API to retrieve performance data. Performance data has two components: static and dynamic.
The static component consists of a name, ID and other descriptive attributes to identify the data. The dynamic component contains information that changes over time, such as the current value of a counter and the time stamp associated with that value.
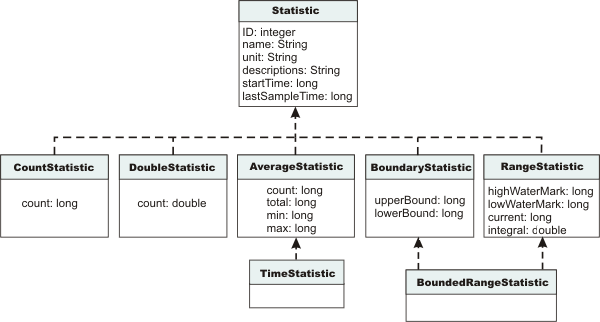
The PMI data can be one of the following statistic types (these statistic types follow the J2EE 1.4 Performance Data Framework):
| Statistic type | Description | Example |
|---|---|---|
| CountStatistic | Represents a running count of a given value. | Number of Servlet requests |
| AverageStatistic | Represents a simple average. Keeps track of total, count, min, and max. The average can be derived by total and count. (This type is WebSphere extension to J2EE Performance Data Framework) | Average HttpSession size in bytes. |
| TimeStatistic | Same as AverageStatistic, except that the unit of measure is milliseconds or seconds. | Average Servlet response time. |
| RangeStatistic | Represents a time-weighted average. Keeps track of current, low water mark, high water mark, time-weight total, and integral. | Number of concurrent Servlet requests. |
| BoundedRangeStatistic | Same as RangeStatistic, with lower bound and upper bound. | JDBC connection pool size. |
The following diagram shows the statistic class hierarchy:

These PMI data types continue to be supported through the PMI client API. Statistical data types are supported through both the PMI API and Java Management Extension (JMX) API.
In WebSphere Application Server, Version 4 and Version 5, CountStatistic data require a low monitoring level, and TimeStatistic data require a medium monitoring level. RangeStatistic and BoundedRangeStatistic require a high monitoring level. There are a few counters that are exceptions to this rule. The average method response time, the total method calls, and active methods counters require a high monitoring level. The Java virtual machine Profiler Interface (JVMPI) counters, SerializableSessObjSize, and data tracked for each individual method (method level data) require a maximum monitoring level. Also, the level maximum enables synchronized update to all the statistic types.
WebSphere Application Server, V6 deprecates the monitoring levels (Low, Medium, High, and Max) and introduces fine-grained control to enable/disable statistics individually. The fine-grained control is available under the custom option. Refer to Enabling PMI using the administrative console for more details.
In order to reduce the monitoring overhead, updates to CountStatistic, DoubleStatistic,
AverageStatistic, and TimeStatistic are not synchronized. Since this data tracks the total and average, the extra accuracy is generally not worth the performance cost. RangeStatistic and BoundedRangeStatistic are very sensitive;
therefore, they are always synchronized. To enable synchronized updates for all the statistic types enable the 'Use sequential update' option. Refer to Enabling PMI using the administrative console for details.
Searchable topic ID: rprf_dataclass