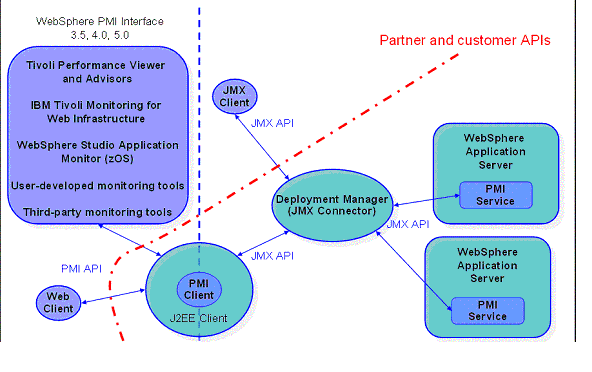
The Performance Monitoring Infrastructure (PMI) uses a client-server architecture.
The server collects performance data from various WebSphere Application Server components. A client retrieves performance data from one or more servers and processes the data. WebSphere Application Server Version 6 supports the JavaTM 2 Platform, Enterprise Edition (J2EE) Management Reference Implementation (JSR-77).
In WebSphere Application Server Version 4 and Version 5, PMI counters are enabled, based on a monitoring or instrumentation level. The levels are None, Low, Medium, High and Max (N, L, M, H, X). These levels are specified in the PMI module XML file. Enabling the module at a given level includes all the counters at the given level plus counters from levels below the given level. So, enabling the module at the Medium level enables all the counters at level M plus all the Low (L) level counters as well.
JSR-077 defines a set of statistics for J2EE components as part of the StatisticProvider interface. The Performance Monitoring Infrastructure (PMI) provides statistics using a monitoring level. The JSR-077 statistics do not match directly with the PMI monitoring levels. So enabling all the JSR-077 statistics out-of-the-box requires PMI to be enabled at a high level, which is not acceptable from the performance standpoint. The requirement is a performance overhead of 2 to 3 percent when frequently monitored statistics are enabled. In WebSphere Application Server Version 5.0, this is measured using the standard set. This poses a new requirement on PMI which is fine-grained control. Fine-grained control gets rid of the PMI levels and allows statistics to be enabled individually. WebSphere Application Server Version 5.0 provided a set of interfaces for retrieving PMI information from Mbeans. JSR-77 defines an identical set of interfaces. In WebSphere Version 6.0, the new interfaces are the default returned from PMI when the stats attribute is retrieved. Additionally, we provide a simple migration tool to assist you with this change. The tool:
To get the old statistics classes returned, you need to set a system property (for example, a -D option) to websphereV5Statistics=true on the client. If this property is set, the PMI interface returns the WebSphere Application Server statistics object instead of an object that implements the J2EE interface.
As shown in the figure below, the server collects PMI data in memory. This data consists of counters such as servlet response time and data connection pool usage. The data points are then retrieved using a Web client, a Java client, or a Java Management Extensions (JMX) client. WebSphere Application Server contains Tivoli Performance Viewer, a Java client which displays and monitors performance data. See the Monitoring performance with Tivoli Performance Viewer (TPV), Monitoring performance with Tivoli Performance Viewer (TPV), Third-party performance monitoring and management solutions, and Developing your own monitoring applications topics for more information on monitoring tools.

The figure shows the overall PMI architecture. On the right side, the server updates and keeps PMI data in memory. The left side displays a Web client,
a Java client, and a JMX client retrieving the performance data.
Related tasks
Enabling PMI data collection
Monitoring performance with Tivoli Performance Viewer (TPV)
Developing your own monitoring applications
Related reference
Third-party performance monitoring and management solutions
Searchable topic ID: cprf_pmi_arch