Creating a Report With Report Assistant
Describes how to use the HTML Report Assistant to create tabular reports.
DB2® Web Query Report Assistant is an HTML-based graphical tool that enables you to select a data source, specify any sorting or grouping information, and display the report in your browser or another desktop application. When you use Report Assistant, DB2 Web Query creates a styled report that you can deploy on the Web without the necessity of learning the complexities of any reporting language. You can then take full advantage of the capabilities of the reporting language to efficiently display your company's data.
At the end of the chapter, reference topics provide details for every field in every tab and sub-tab.
If you are using the HTML Report Assistant with a Firefox browser, the display may be slightly different than Internet Explorer. These differences do not effect functionality.
Parent topic:
IBM DB2 Web Query for System i Overview
Accessing HTML Report Assistant
HTML Report Assistant is accessible when creating or editing a Report.
Selecting the Master File in Report Assistant
To choose the Master File to work with, select the file and click OK. To search for a specific Master File, use the scroll bar.
The following image shows the Browse Data dialog box containing available data descriptions for selection.

You can also type the first character of the name of the Master File anywhere in the list to jump to the name of that Master File.
Layout of Report Assistant
Report Assistant builds your report as you select graphical options by internally constructing a procedure according to the rules of the reporting language.
The following image shows the Report Assistant which is divided into these sections or tabs:
Each tab contains explanatory text designed to guide you on using the specific features accessed within the tab.
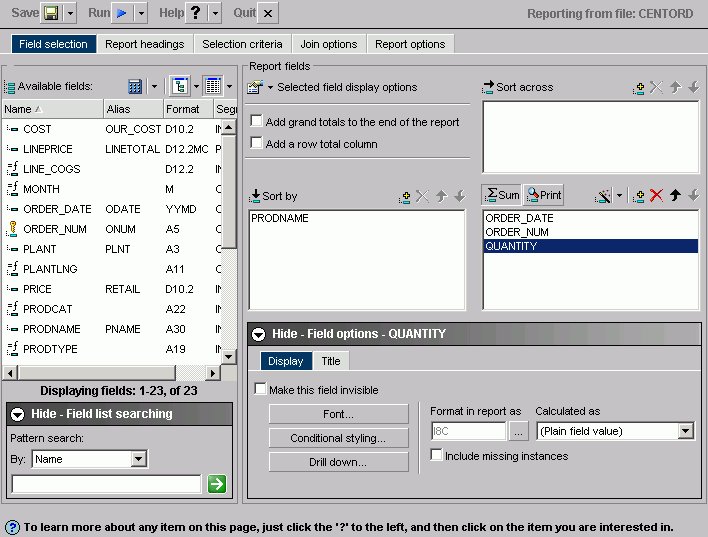
Each tab contains a set of options that enable you to customize both the content and appearance of your report. To toggle between tabs, select each tab at the top of the window. Click About under the Help button to display the version and release number of Report Assistant.
Above the tabs there are buttons for:
- Save/Save As
-
Click Save to save your report.
Click Save As to open the Save New Report dialog box.
- Run
-
Click run to run your report.
- Help/About
-
Click the icon to access help about the area of the tab in which you are working.
Click About to open a window describing the version of Report Assistant in which you are working.
- Quit
-
Click to quit the application.
Building Your Report With Report Assistant
The most basic report you can construct is a tabular report. Other report types build on the basic design of the tabular report. A tabular report is a report whose information is arranged vertically in columns. Internally, DB2 Web Query constructs your report with a series of simple commands that mark the beginning of the request, identify the data source, and mark the end of the request. Other aspects of the request, such as styling information, are not necessary to produce a valid report request.
Use the following basic steps in constructing your report:
- Design your presentation. How would you like to organize the information in your report?
See Selecting Report Fields for more information about establishing basic organizational criteria for your report.
- Identify the information you would like to present. Is it a full data set, or do you want to construct a subset of some larger set?
See Selecting Records for a Report for more information about establishing selection criteria for your data.
- Style your presentation. Do you want to apply customized headings or footings to your report to make it more dynamic?
Selecting Report Fields
Begin building your report in the Field selection tab by selecting fields to include. A field is the smallest meaningful element of data in a file. DB2 Web Query lists available fields in several formats:
- As a list of fields shown in the following image.
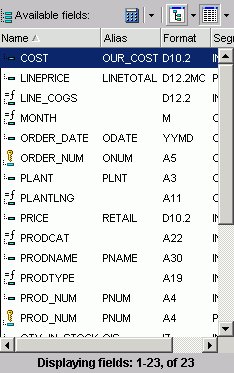
List is the default. To enable List mode, you click the List icon in the Available Fields box. You can view one or more options by clicking the Options arrow and selecting: Name, Alias, Title, Format, Description, Segment, and Filename. In List mode, you can sort any list of variables alphabetically from a to z or from z to a by clicking the attribute, for example, Name or Alias.
If you choose an option, such as alias, it does not appear with a DEFINE, COMPUTE, or drill-down.
- As a tree separated by segments (the Field Tree) when expanded, as shown in the following image.

- As a tree separated by Dimensions (the Dimension Tree), as shown in the following image. This is applicable only when the OLAP license option is activated.
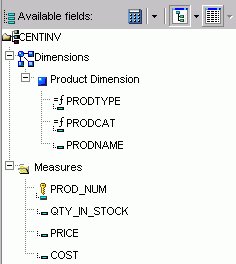
If you are viewing a Fields List in the Dimension Tree mode and you create a recursive join (joining a file to itself), you will not be able to view the Dimensions in the Fields List after the join is created. This is due to duplication of field names in a recursive join. If you delete the join, you will be able to view dimensions again.
To enable Tree mode, you click the Tree icon in the Available Fields box. Click the arrow next to the Tree icon to select the Field Tree or the Dimension Tree. The following options appear in a pop-up as you mouse over each field: Segment, Name, Alias, Title, Description, and Format. You can change the field attributes that appear in the tree by selecting from the list shown when clicking on the tree icon. Select from: Name, Alias, Title or Description.
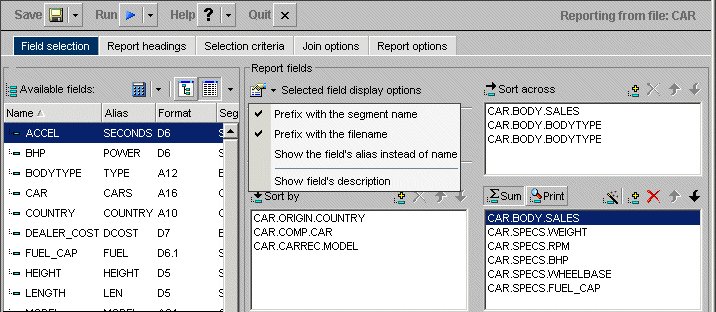
The Report fields section enables you to use the prefix with the segment name or filename. You can also show the field's alias instead of the name. You can show the field's title or description instead of name or alias, but title and description cannot be prefixed with the segment name or filename. The qualified field identification cannot exceed 66 characters.
Your selections in the Report Fields menu remain in effect for your current browser session and are automatically saved with your request.
Field names that contain a hyphen "-" cannot be used in the HTML Report Assistant.
Notes on the Fields List
- Key fields are represented with a key icon in all field lists (tree and list displays)
in the HTML Report and Graph Assistant.
The number of fields that are currently displayed shows at the bottom of the fields list. If a field list contains more than 200 fields, the first 200 fields display initially. Additional fields are retrieved and displayed when you select the next set of fields.
- To select the next set of fields, scroll to the bottom of the field list and select the Next option that appears. The Next option describes which fields will be returned, for example in the following image it shows that the next 201-400 fields of 417 will be retrieved:

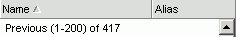
- To go back, scroll to the top of the field list and select the previous set of fields. For example, the following image shows the Previous option to select the previous 1-200 of 417 fields:
Fully Qualified Field Names
The HTML Report Assistant always saves a procedure with its fully qualified field name. If you want to view this information, click the Prefix with the segment name and Prefix with the filename options in the Report Fields section of the Field selection tab.
Viewing Fully Qualified Field Names
Prefix with the segment name and Prefix with the filename are checked. Note that the fields under Sort by demonstrate the field, segment, and filenames.
The following image shows the result after selecting both the prefix with segment name and prefix with the filename.
If you open a report procedure in the Editor, the fields appear with their qualifiers prefixed to the field name or alias.
The information for the highlighted field appears. If multiple fields are selected, the information that appears applies to the last field chosen.
Adding Totals and Grand Totals to a Report
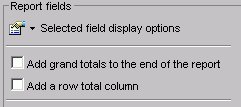
You can add grand totals to the end of your report and add a row total column by checking the appropriate boxes under Report fields as shown in the following image.
Using the Sort By, Sort Across, and Column Phrases to Organize Data
Select report fields by highlighting the field and clicking the Add icon for the vertical and horizontal Sort fields (Sort by and Sort across) and Sum or Print for the data fields. From either the List or Tree view, you can drag and drop or use Add.
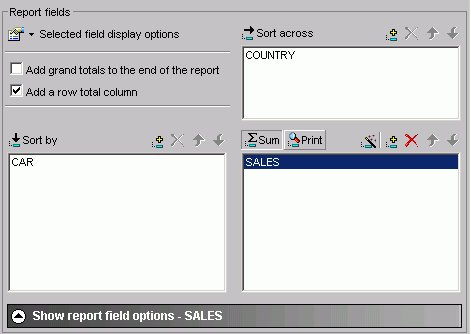
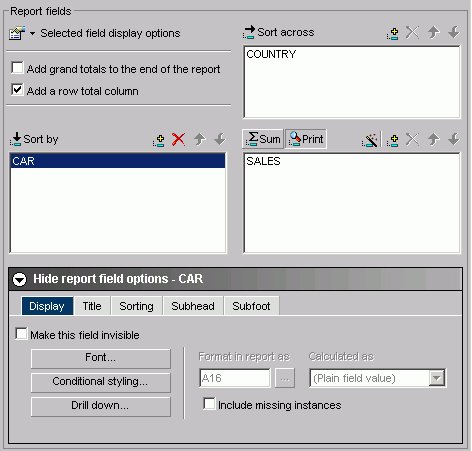
The following image shows a field selected in each of the data field boxes, the COUNTRY field in the Sort across data field box, the CAR in the Sort by data field box, and the SALES field in the Column box.
Specifying sort phrases enables you to organize the presentation of information in a desired sequence. Adding fields to the Sort across fields box establishes the field you selected as a column in your report. You can create a matrix report by combining sort and across phrases. You can include a maximum of five ACROSS fields in each report. If you try to enter a sixth ACROSS field, the following message appears:
The Maximum number of horizontal dimensions is 5.
Adding fields to the Sort by fields box establishes your field as a sort field in your report. Sort fields (also known as BY fields) are rows in your report. Any field can be a sort field and you can include up to 32 sort fields in a report.
The Column data fields box designates the selected field as Sum or Print (Detail). After selecting the field, also decide if you want DB2 Web Query to add the values together (Sum) or print the values individually (Print). DB2 Web Query displays the field you select in the last column of your report and performs the requested operation on the data (Sum or Print). The default selection is Sum.
You must select at least one field for the Sort or Column box to create a report.
Add Report Fields in Tree or List View
- Click the Tree or List icon.
- Select the field from the Available fields window and click the Add icon to the Sort by, Sort across, or Column fields box to add the chosen field.
or
Click and hold the left mouse button, and drag the field to the fields box you chose.
or
Use the shortcut keys to quickly go to one of the field boxes.
In the following table the first column (Field Box) describes where you go when using the shortcut keys and the second column (Shortcut Keys) defines the shortcut key combination.
Field Box
Shortcut Keys
Sort across
Alt+A
Sort by
Alt+S
Column
Alt+C
Press Alt+M to go to the Available Fields window, tab to the field and press Enter to add the chosen field.
Multi-Select Fields in List View
- Click the List icon.
- If the fields are:
- Adjacent to each other, click the first field you want to select and hold down the Shift key while clicking the last field you want to include in the report.
- Not adjacent to each other, hold down the Ctrl key while clicking the fields you want to include in the report.
- Adjacent to each other, click the first field you want to select and hold down the Shift key while clicking the last field you want to include in the report.
- Click the Add icon to the Sort across, Sort by, or Column fields box to add the chosen fields.
Multi-select of fields is only possible when in List mode. You must drag and drop or use the Add icon to add individual fields when in Tree mode.
Select a Report Type
To select a report type, click one of the following buttons in the Column box:
- Sum. A summary report shows the summarized values of the selected data source fields.
- Print. A detailed report shows all selected records from a data source.
Delete Report Fields
- Select the field in the Sort Across, Sort by, or Column fields box.
or
Use the shortcut keys to quickly go to one of the field boxes. In the following table the first column (Field Box) describes where you go when using the shortcut keys and the second column (Shortcut Keys) defines the shortcut key combination.
Field Box
Shortcut Keys
Sort across
Alt+A
Sort by
Alt+S
Column
Alt+C
Use the arrow keys to move to the field you wish to delete.
- Click the Delete button or press the Delete key.
Searching Field Lists
You can search the field list on the Field selection tab, Report Headings tab, Selection criteria tab, and Join options tab (for the host Master File) in the HTML Report Assistant and HTML Graph Assistant. You can search by the following Master File attributes: Name, Alias, Title, Format, Description, Segment, and Filename.
When you apply a search to a field list, your search results appear in all other areas of the tool, until you reset the field list. Your search results are saved when you exit the tool, so when you open the procedure again, you only see the results of your search in the field list.
- The field list that appears for conditional styling is already restricted to the fields selected for the report and is not further restricted by the search string.
- Search options are available when viewing fields in List mode. It is not available when viewing fields in Tree mode.
Search a Field List
- In the Field selection tab, Headings tab,
or Selection criteria tab in the HTML Report Assistant or HTML Graph Assistant,
click Show - Field list searching.
If you are searching for a field name from the Join options tab, click the Field list searching
 icon.
icon.
The Field list searching dialog box opens.
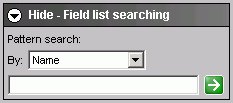
The following image shows the Field list searching dialog box. It contains a drop-down list for what pattern you want to search by, a text box, and a submit button.
- Select the Master File attribute for which you want to search. The following table lists the pattern attributes and a description of each.
Attribute
Description
DSPFFD Equivalent
Filename
Name of the data source.
File
Name
Name of the field.
Field
Alias
Alias for the field.
Alternative Name
Title
Display title for the field, as defined in the Master File.
Column Heading
Format
Field format, for example A4.
Data Type
Description
Field description, as defined in the Master File.
N/A
Segment
A segment of fields in the Master File.
N/A
- Type your search string. You can use an asterisk (*) as a wildcard. For example, type c* to find all fields that begin with the letter "c". The character string is not case sensitive.
- Click the right arrow
 and results appear in the field list.
Reset the Field List After a Search
- In the Field selection tab, Headings tab,
or Selection criteria tab in the HTML Report Assistant or HTML Graph Assistant,
click Show - Field list searching.
If you are searching for a field name from the Join options tab, click the Field list searching
icon.
The Field list searching dialog box opens.
- Enter a blank value (space bar) or an asterisk (*) and click the arrow
.
The field list is reset to the default display, which is to show all fields.
Creating Temporary Fields
A temporary field is a field whose value is not stored in the data source, but can be calculated from the data that is there, or assigned an absolute value. When you create a temporary field, you determine its value by writing an expression. You can combine fields, constants, and operators in an expression to produce a single value. For example, if your data contains salary and deduction amounts, you can calculate the ratio of deductions to salaries using the following expression: deduction / salary.
You can specify the expression yourself, or you can use one of the many supplied functions that perform specific calculations or manipulations. In addition, you can use expressions and functions as building blocks for more complex expressions, as well as use one temporary field to evaluate another.
There are two types of temporary fields—a virtual field and a calculated value—which differ in how they are evaluated:
- A virtual field (Define) is evaluated as each record that meets the selection criteria is retrieved from the data source. The result of the expression is treated as though it were a real field stored in the data source.
Virtual fields (Defines) are not applicable to queries that originated in IBM Query/400. They can be used only with new queries created in the Web Query product.
- A calculated value (Compute) is evaluated after all the data that meets the selection criteria is retrieved, sorted, and summed. Therefore, the calculation is performed using the aggregated values of the fields.
You can create temporary fields from the Field selection tab.
Create a Temporary Field
- On the Field selection tab, click the:
- New define field
 icon (located above the fields list) OR the
- New computed field
 icon (located with the Sum/Print fields).
The Field Creator dialog box opens.
- New define field
- Enter the name for the field in the Field box. Field names for temporary fields cannot exceed 66 characters.
- Enter the format for the field in the Format box. Click the Format button for assistance in selecting a format. See Change Format Dialog Box.
- Click in the expression box to enter an expression.
If you are familiar with coding Compute and Define expressions, you can type the expression in the text box. Otherwise, you can use the key pad to assist you in creating the expression. To use the key pad:
- Click the Tree or List button to open the fields list or click the Functions button to open the DB2 Web Query functions list. If you hover your cursor over a function, a brief description appears.
- Double-click a field or function to add it to the expression box.
- If you select a field, complete the expression using the key pad and additional fields, as necessary. See Field Selection Tab: Field Creator Dialog Box for details on key pad operations.
- Click the Tree or List button to open the fields list or click the Functions button to open the DB2 Web Query functions list. If you hover your cursor over a function, a brief description appears.
- Click OK. New calculated values (Compute) are added to your report's column (Sum/Print) list. New virtual (Define) fields are added to the fields list, where you can select them as if they were real fields.
When you create a defined field in Report Assistant, if you want that field value to be blank, the blank must be contained in quotation marks.
Edit a Temporary Field
- Select the temporary field.
- Click the down arrow next to the Define icon and select Edit define field.
or
On the Column box, click the Edit computed field menu item.
The Field Creator dialog box opens.
- Make your desired edits and click OK.
Delete a Temporary Field
Select a column field in the Column box and click the Delete icon (or press the Delete key).
or
- Select a virtual field in the Available fields box.
- Click the down arrow next to the Define icon.
- Click Delete define field.
Examples of Creating A Virtual Field and Creating a Calculated Value
The following are examples of creating a virtual field and creating a calculated value.
Creating a Virtual (Defined) Field Using a Function
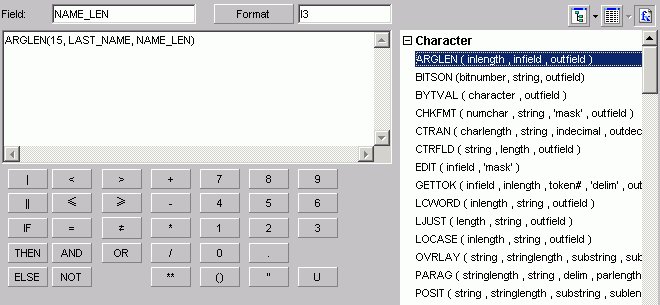
The following image shows the Define field creator dialog box with a defined field that uses a function (ARGLEN). This field uses the EMPLOYEE sample data source.
Creating a Calculated (Computed) Value
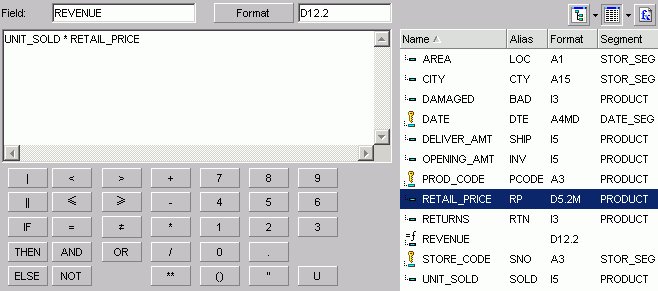
The following image shows a computed field created using the SALES sample data source. The expression creates the computed field REVENUE based on the product of the existing fields UNIT_SOLD and RETAIL_PRICE.
Changing a Field Format
The following image shows the Change Format Dialog box, which you use to assign a format to a virtual or column field. Refer to the following procedures for the step-by-step instructions.
Assign an Alphanumeric Format
- Required: Select the virtual or column field.
- Required: Click the down arrow next to the Define icon and select Edit define field.
or
Click the New computed field icon.
The Field Creator dialog box opens.
- Click Format.
The Change Format dialog box opens.
- Select the Alphanumeric option button in the Format Types option button group.
- To assign a different length, specify a number between 1 and 256 in the Length spin box.
- Click OK twice to close the Change Format dialog box and return to the Field selection window. The new format appears in the Format column in the Available fields list.
Assign a Numeric Format
- Select the virtual or column field.
- Click the down arrow next to the Define icon and select Edit define field.
or
Click the New computed field icon.
The Field Creator dialog box opens.
- Click Format.
The Change Format dialog box opens.
- Select one of the following option buttons in the Format Types option button group:
- Floating Point (default length 7.2)
- Integer (default length 5)
- Decimal (default length 12.2)
- Packed (default length 12.2)
If the selected field matches the selected format type, its current length appears in the Length spin box. Otherwise, the default length appears in the Length spin box. The Decimal spin box shows the number of decimal places for Floating Point, Decimal, and Packed.
- Floating Point (default length 7.2)
- To assign a different length, specify numbers in the Length spin box for format types as follows: 1- 9 for Floating Point,
1- 11 for Integer, 1- 20 for Decimal, and 1- 33 for Packed.
- To assign a different number of decimal places for Floating Point, Decimal, or Packed, specify the number in the Decimal spin box.
- Click OK twice to close the Change Format dialog box and return to the Field selection window. The new format appears in the Format column in the Available fields list.
Assign a Date Format
- Select the virtual or column field.
- Click the down arrow next to the Define icon and select Edit define field.
or
Click the New computed field icon.
The Field Creator dialog box opens.
- Click Format.
The Change Format dialog box opens.
- Select the Date option button in the Format Types option button group. The default date display format is MDY.
- To assign a different date display format,
click the down arrow to the right of the Date Format list box.
- Choose a date format.
- Click OK twice to close the Change Format dialog box and return to the Field selection window. The new format appears in the Format column in the Available fields list.
Add a Percent Sign to a Numeric Field
You can add a percent sign to the end of a numeric value (Decimal, Integer, Floating Point format types). This numeric display option includes a percent sign along with the numeric data, but does not calculate the percent.
- Select the virtual or column field.
- Click the down arrow next to the Define icon and select Edit define field.
or
Click the New computed field icon.
The Field Creator dialog box opens.
- Click Format.
The Change Format dialog box opens.
- Click the down arrow in the Select options list box to choose Percent sign - %.
- Click OK twice to close the Change Format dialog box and return to the Field selection window. The new format appears in the Format column in the Available fields list.
Using the Percent Sign Edit Option
The following table consists of a Format column for each numeric format, a Data column for its actual data value, and a Display column for how it appears.
|
Format |
Data |
Display |
|---|---|---|
|
I2% |
21 |
21% |
|
D7% |
97 |
97% |
|
F3.2% |
48 |
48.00% |
Using Calculated Values From the Master File
In the HTML Report and Graph Assistants, calculated values (COMPUTEs) that exist in the Master File appear in the fields list with all other temporary virtual fields and calculated values. The following image shows the fields list in the HTML Report Assistant with a calculated value from the Master File (PROFIT).

Calculated values from the Master File are available in all fields lists in the HTML Report and Graph Assistant except for the fields lists that appear for Define fields and Joins.
Support for Calculated Values From the Master File
You can use a calculated value from the Master File:
- As a Sum/Print field.
- As a Sort by field. You can also use a temporary calculated value as a Sort by field.
The By sort is automatically converted to a Total field since calculated values are calculated after data has been sorted and aggregated, but before the report is displayed. Since sorting (BY) has already been done, the phrase BY TOTAL is used to indicate that this sort is performed after any BY sorting. This applies to calculated values from the Master File and temporary calculated values.
- For conditional styling.
- In a temporary calculated value.
- In a page heading or page footing (Report headings tab).
- In selection criteria statements. You can also use a temporary calculated value in selection criteria.
When you use calculated values for selection criteria, the Where is automatically converted to Where Total. This occurs because the Where Total is added after the data is retrieved and sorted, but before the report is finalized. This applies to selection criteria created with calculated values from the Master File and temporary calculated values.
Calculated fields from the Master File are not supported:
- As Across sort fields.
- As the X-axis in a graph. This means that you won't be able to add a calculated value to the Field value plotted on X axis or Create a separate graph for each value of this field fields on the Field selection tab of the HTML Graph Assistant.
- In a Join statement or Defined field.
- With prefix operators, for example MAX.
Calculated Value Dependencies
These dependencies apply to calculated values from the Master File and to temporary calculated values.
When you include a calculated value in selection criteria or in a page heading/footing, the field must exist in the report as either a By sort field or a Sum/Print field. If you create a selection criteria statement with a calculated value or add a calculated value to a page heading/footing and the field does not already exist in the report, then it is automatically added to the Sum/Print display field list. The Make this field invisible option is automatically selected in the Field options dialog box so that the calculated value does not appear in the output. When this occurs, a message appears stating:
"The field has been added to the list of fields in the report."
You do not see this message for temporary calculated values (those that do not come from the Master File) that are added to a page heading/footing since these already appear in the Report headings fields list.
You can change the attributes of the calculated value from the Field options dialog box on the Field selection tab. If you attempt to delete the calculated value from the Sum/Print display list and the same field exists in either selection criteria or in a page heading/footing, you receive a one of the following messages:


You must remove the field from the page heading/footing or selection criteria before you can remove it from the Sum/Print display list.
Defining Field Characteristics
To choose field options, select the field in the Sort across, Sort by, or Column (Sum/Print) box in the Field selection tab. Click Show field options to style each field in your report.
The following table lists and and describes the available Field options in the Display, Sorting, Ranking, Subhead, and Subfoot tabs that appear for each selected field type. The ability to create a title in the Title tab is available for all field types. If a Field option tab is not available for a selected field type, "n/a" appears in the table.
|
Field Type |
Display |
Sorting |
Ranking |
Subhead & Subfoot |
|---|---|---|---|---|
|
Sort across |
Make this field invisible check box Font button that opens styles dialog Drill down button that opens Drill down dialog |
Ascending/ Descending options Total check box |
n/a |
n/a |
|
Sort by |
Make this field invisible check box Font button that opens styles dialog Conditional styling button that opens conditional styling dialog Drill down button that opens Drill down dialog Include missing instances check box |
Ascending/ Descending options Total check box Create a page break check box (activates the 'And reset page number to 1' check box) Separate with underline check box Subtotal numeric sum/print fields check box (activates the Subtotal tab, and the 'And higher level sort fields' and 'Recalculate computed fields with subtotals' check boxes |
Add Ranking column check box (activates the 'Limit the number of ranked values to' check box, and the Font button that opens styles dialog) |
Select Font type, size, and style. Select text alignment. Set text and background colors. |
|
Column (Sum/ Print) |
Make this field invisible check box Font button that opens styles dialog Conditional styling button that opens conditional styling dialog Drill down button that opens Drill down dialog Format in report as button opens change format dialog 'Calculated as' drop-down list adds prefix to column Include missing instances check box |
n/a |
n/a |
n/a |
You can use this table to determine which of the following options are available for a selected field in the Field selection tab:
- Suppress the display of a field (make a field invisible).
- Apply font options with the styles dialog box.
- Apply conditional styling with the conditional styling dialog box.
- Create drill down parameters with the Drill down dialog box.
- Select format options in the report with the change format dialog box.
- Specify how the field will be calculated by choosing an option from a drop-down list box.
- Include references to missing instances in reports.
- Specify field display titles, subheads, subfoots, and subtotals.
- Specify ascending or descending field sorting.
- Include the Sort by options for page breaks.
- Include the Sort by options for subtotals, sub-totals, and recalculated subtotals.
- Subtotal numeric sum/print fields is not checked by default. If checked, numeric values are summed and a subtotal is displayed when the selected Sort by field value changes.
- If you select And higher level sort fields, SUB-TOTAL syntax is used to display subtotals for numeric values when the selected Sort by field value changes and when any higher-level Sort by field value changes.
- If you are using computed fields, select Recalculate computed fields using subtotal values.
Change the Field's Display Title
- Select the field whose title you want to change.
- If hidden, click Show report field options for the selected field.
- Click the Title tab.
- Enter the title you want to display in the report output.
When using HTML output, leading spaces in the field title do not display.
Suppress the Display of a Field
The Field selections tab enables you to conceal the data of a selected field in a report. To suppress the display of a field:
- If hidden, click Show report field options for the selected field.
- Check the Make this field invisible check box.
Include References to Missing Instances in Reports: The ALL. Prefix
In a report, you can include parent segment instances that lack descendants by attaching the ALL. prefix to one or more column fields, as follows:
- If hidden, click Show report field options for the selected field.
- Check the Include missing instances check box.
- The ALL. prefix and an additional prefix operator from the Column Options drop-down list may be applied to the same field.
- The ALL. prefix can be applied to multiple fields.
- The ALL. prefix can be applied to both column fields and sort fields.
Arrange Fields in Ascending or Descending Order
To list sort field data in the report from greatest to smallest (descending) or from smallest to greatest (ascending):
- If hidden, click Show report field options for the selected field.
- Select the Sorting tab.
- Select the Ascending or Descending option button.
- Click Save.
If you have multiple sort fields, you can specify a different order for each one.
Include Page Breaks
To start a new report page when the value of a selected sort field changes:
- If hidden, click Show report field options for the selected field.
- Select the Sorting tab.
- Check the Create a page break check box.
- Click Save.
Include Subtotals
To display a subtotal for numeric data when a selected sort field changes:
- If hidden, click Show report field options for the selected field.
- Select the Sorting tab.
- Check the Subtotal numeric sum/print fields check box.
Subtotals are activated for this report and the Subtotal tab appears to the right of the Subfoot tab. Note that the default *TOTAL title is displayed next to each subtotal value. For more information, see Include Display Titles for Subtotals.
Additionally, the following options are activated:
- And subtotal all higher level sort fields. Displays subtotals for numeric values when the Sort by field value changes and when any higher-level Sort by field value changes.
- Recalculate computed fields with subtotal values.
- And subtotal all higher level sort fields. Displays subtotals for numeric values when the Sort by field value changes and when any higher-level Sort by field value changes.
- Required: Optionally,
select the Subtotal tab to:
- Modify the default subtotal title text in the Current Subtotal Text field.
- Suppress subtotals for sort fields that have only a single value.
- Apply subtotals to a subset of the numeric fields in a report.
- Apply prefix operators, which enables you to display the sum, average, average square, count, first in group, last in group, minimum, or maximum value for any or all of the numeric fields, including Computes, in a report.
For more information, see Displaying Subtotals and Other Summary Values Using Prefix Operators.
- Modify the default subtotal title text in the Current Subtotal Text field.
- Click Save.
Include Display Titles for Subtotals
When including subtotals, you can also specify display titles for them. These titles appear next to each subtotal in the report. The default subtotal display title is *TOTAL. To edit the default display title:
- If hidden, click Show report field options for the selected field.
- Click the Sorting tab.
- Check the Subtotal numeric sum/print fields check box. The Subtotal tab appears to the right of the Subfoot tab.
- Click the Subtotal tab.
- Type the desired display title in the Current Subtotal Text field in the Subtotal tab.
- Click Save.
If the Subtotal numeric sum/print fields check box is not selected, subtotals are not displayed in the report.
Include Subheads/Subfoots for Sort Fields
The Fields Options tab enables you to include subheads (which appear above) and subfoots (which appear below) for each of the sort field's records in the report.
- If hidden, click Show report field options for the selected field.
- Click the Subhead or Subfoot tab.
- Click in the text box or press Alt+T to enter a subhead or subfoot title.
- Style the subhead/subfoot using the formatting toolbar.
- Click Save.
Editing a Field Format
Use the report field options section on the Field selection tab to change the field format for the Column field. The following image shows the Field selection tab with a field selected and the Field Options pane open.
Change Field Format for a Column Field
- Required: If hidden, click Show report field options.
- Required: Select a field in the Column box.
- Required: Click the ... button to open the Change Format dialog box.
- Select the option for the field and click OK.
Styling Fields
Use the styling options on the Field selection tab to style report fields.
Style Sort by, Sort Across, or Column Fields
- If hidden, click Show report field options.
- Select a field and click the Display tab in the report field options section.
The following image shows the Display tab of the Field Options pane.
- Click the Font button.
- Select the desired styling options from the Font, Style, and Size boxes.
- In the Set Styles for box, select the Title & Data, Title Only, or the Data Only option button, depending on the report element you wish to style.
If you select a font property (font, style, size, text color, background color, or justification) and select the Title & Data option button, the changes will be reflected in both the Title Style and Data Style boxes.
However, if you then select a different parameter for a given property using the Title Only option button, the Title Style will change while the Data Style will not reflect this change. To change the Data Style, click the Data Only option button and then make your change. Likewise, if you select the Data Only option button and make a change, this change will not be reflected in the Title Style. You must click the Title Only option button to make your change.
- Choose a text color from the list box.
- Choose a background color from the list box.
- Choose a justification (left, center, or right) from the list box.
- Click OK.
Clicking Reset returns the styling options to the following default settings:
- Font: Times New Roman
- Style: Normal
- Size: 13
- Text Color: Black
- Background Color: Transparent
- Justification: Left
Drilling Down to New Procedures
When you click Drill Down in the report fields options section on the Field selection tab, the No action option button is the default. When you select Execute Procedure, a list of procedures contained within the Reports subfolder displays. You can also select procedures from different domains.
For more information, see Drill Down Dialog Box.
End User Drill-down Capability
Along with Administrators and Developers, end users can drill down to other reports from within the currently displayed report.
Styling Specified Field Values
Use the Conditional Styling dialog box to style records based on specified field values. Conditional styling, also referred to as stoplighting, enables you to define conditions that determine when to apply particular fonts, point size, text style, foreground and background color, and drill down procedures to your report's data when the report is run.
You can style specified values for one or several column and sort fields. However, you cannot style values for sort across fields.
Style Records Based on Specified Field Values
- In the HTML Report or Graph Assistant, if hidden, click Graph Field Options.
- Click the Display tab in the report field options section.
- Click the Conditional styling button.
The Conditional Styling dialog box opens.
- Click the Add button and create a new condition.
The following image shows the edit condition dialog box that opens where you begin to set the conditional styling.

- Provide a meaningful and unique file name in the Condition input box.
- Select a field name from the Field list box and a relation from the Relations list box.
- To specify a value that completes the relation,
first select one of the following in the Compare Type option button group:
- Value, to compare the selected report field to a data source value or literal value.
- Another Field, to compare the selected report field to the value of another field. The list of report fields appears in the possible values area. Select one of the report fields to compare to.
- Value, to compare the selected report field to a data source value or literal value.
- If you select Value under Compare Type,
perform one of the following to complete the relation:
- Click Values to display existing data source values in the Value list box, and select a value.
- Type a literal value in the Value input box.
- Click Values to display existing data source values in the Value list box, and select a value.
- Click OK.
You return to the Conditional Styling dialog box.
Creating Parameters
Parameters enable you to specify criteria and conditions for drill-down reports. By defining parameters, you can control the amount and type of information to retrieve when you click a hotspot.
Create a Parameter in the Main and Drill Down Procedures
- Select the Selection criteria tab.
- Create an expression (WHERE statement) that defines a parameter. For more information, see Creating a Where or Where Total Statement.
- If hidden, click the Show report field options section.
- Select the field that you want to drill down on, for example, Product.
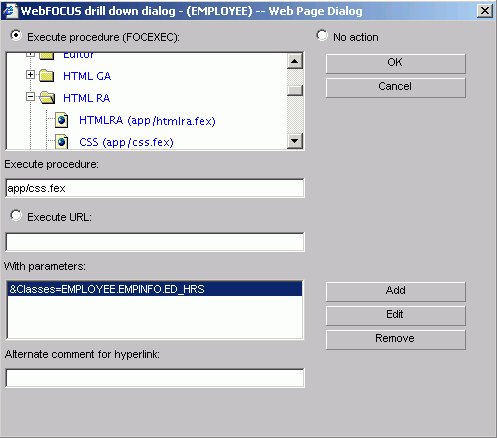
- Click Drill Down. The DB2 Web Query Drill Down Dialog opens.
- Click Execute Procedure (FOCEXEC) or Execute URL.
The following image shows the Execute Procedure option button selected and the location and procedure name of the drill-down report (app/css.fex) in the Execute procedure field.

- Click Add.
The Drill Down Parameter Dialog box opens where you create the drill down parameter.
The following image shows the Drill Down Parameter dialog box, which contains a text box where you enter the name of the parameter, and option buttons to select the parameter as a field or a constant value.
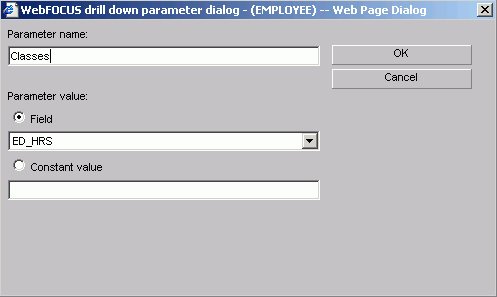
- Enter the name of the parameter you created in the drill down procedure in the Parameter Name text box, for example, Classes.
When passing parameters to a drill-down procedure, use local amper variables (&variables). Global amper variables (&&variables) cannot be used as drill-down parameters. Also, when entering your parameter name it is not necessary to type an ampersand (&) before the parameter name. This will create a global amper variable that cannot be used as a drill-down parameter.
- When you pass the parameter to the drill down procedure, set a value for it in the Drill Down Parameter dialog box. If you select:
- Field. The parameter will be set to the corresponding value of the object the user drills down on in the specified field.
- Constant value. The parameter is set to the specified value.
If the drill-down report contains a -DEFAULTS statement that sets a default value to the same amper variable passed from the main report, the amper variable value passed down overwrites the -DEFAULTS statement in the target procedure.
- Field. The parameter will be set to the corresponding value of the object the user drills down on in the specified field.
- Once a value has been supplied, click OK to return to the Drill Down Dialog box.
The parameter is added to the With Parameters list box as shown in the following image.
Aggregating and Sorting Fields
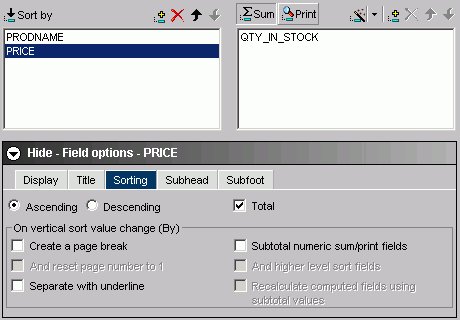
You can apply aggregation and sorting simultaneously to numeric columns in your report in one pass of the data using the Total sort option. The Total option is available for Sort by and Sort across fields. For the Total sort option to work correctly, have an aggregating display field, such as Sum, in the report. A non-aggregating display field, such as Print, simply retrieves the data without aggregating it.
When you add a computed field to the Sort by field, it is automatically given the Total property.
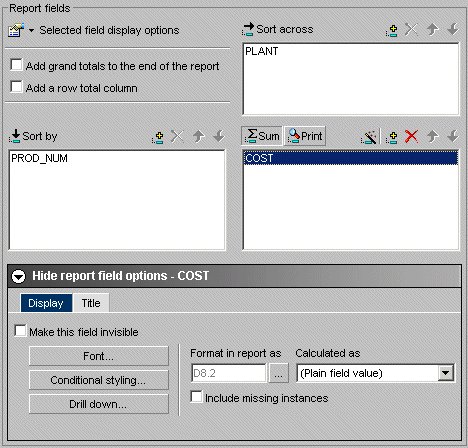
The following image shows the PRICE field with the Total option selected in the Field options.
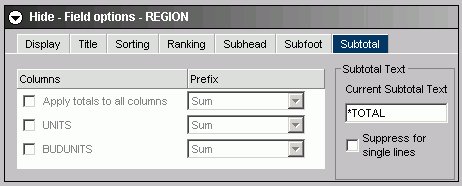
Displaying Subtotals and Other Summary Values Using Prefix Operators
The Subtotal tab enables you to display subtotals, and other summary values using prefix operators, for any or all of the numeric fields, including computed fields, for a selected Sort by field in a report query. You can choose to display subtotals for all numeric fields whenever a selected Sort by field value changes, or you can select to display subtotal and other summary values for a subset of the numeric fields.
In the Subtotal tab, as shown in the following image, you can customize the title text used to display subtotals and other summary values, and suppress subtotals for sort fields that have only a single value, in addition to working with prefix operators.
Display Subtotals and Other Summary Values Using Prefix Operators
To access the Subtotal tab to apply subtotals, prefix operators, and modify other subtotal text and settings, perform the following steps:
- If hidden, click Show report field options for the selected field.
- Select the Sorting tab.
- Select the Subtotal numeric sum/print fields check box. The Subtotal tab appears to the right of the Subfoot tab.
- Select the Subtotal tab.
- Numeric field values are summed and displayed as subtotals in the report by default. To display summary values other than the default subtotals, select prefix operators using the drop-down lists in the Prefix area that are adjacent to each of the selections in the Columns area. Note that the Sum prefix produces the same subtotal results as not selecting a prefix operator.
All of the available prefix operators are listed and described in the following table:
Prefix
Description
Displayed in Prefix List
SUM. Compute the sum of values Sum ASQ. Compute the average sum of squares Average Square AVE. Compute the average value Average CNT. Count the items Count FST. Select the first value only Show first in group LST. Select the last value only Show last in group MAX. Select the maximum value only Maximum MIN. Select the minimum value only Minimum - To display all numeric field values as subtotals or other summary values in the report, select the Apply totals to all columns check box in the Columns area.
- To display subtotals or other summary values for a subset of the numeric fields in the report, make sure the Apply totals to all columns check box is de-selected, then select check boxes for the individual numeric fields in the Columns area of the Subtotal tab.
When Apply totals to all columns is selected, options for all individual fields in the Columns area are inactive by default.
- To modify the default subtotal title, which is set to *TOTAL, type the desired text you want to display as the title for all subtotals and any other selected summary values in the Current Subtotal Text field.
- To hide subtotals for sort fields that have only a single value, select the Suppress for single lines check box.
- Click Save to save your settings and selections in the report query in which you are working.
Applying Predefined and Cascading StyleSheets
You can select a predefined StyleSheet from Report Assistant, instead of applying custom styling. A predefined StyleSheet is a StyleSheet that a DB2 Web Query Administrator places in a domain using Developer Workbench. Any user who then accesses Report Assistant from the domain can apply the predefined StyleSheet to their report.
When a new procedure is created, Report Assistant sets a default StyleSheet. You can apply a different StyleSheet to a report using the StyleSheet drop-down menus in the Global report styling area of the Report options tab.
The following image shows the report styling options in the Report options tab.

The Global report styling section includes the Apply an existing DB2 Web Query Style Sheet and Apply an existing Cascading Style Sheet list boxes. To apply a StyleSheet to a report, select a StyleSheet from the appropriate list box. The list box for DB2 Web Query StyleSheets includes all StyleSheet files stored in the domain.
When a predefined StyleSheet is applied to a report, Report Assistant disables all customizable styling options and does not apply any previous styling selections for the entire report. These settings are not lost. If you decide not to apply a predefined StyleSheet, Report Assistant restores the report's original styling settings and enables you to further customize a report's styling.
When applying a StyleSheet, if you select the Format HTML Output check box, use only the Full or Paged setting. The Fixed setting is not supported with StyleSheets.
Customizing Headings and Footings
Use the Report headings tab to specify the content, style, and placement of headings and footings in your report. Headings and footings can be customized only if a StyleSheet has not been applied. Since Report Assistant applies a StyleSheet by default, set the StyleSheet in the Report Options tab to None.
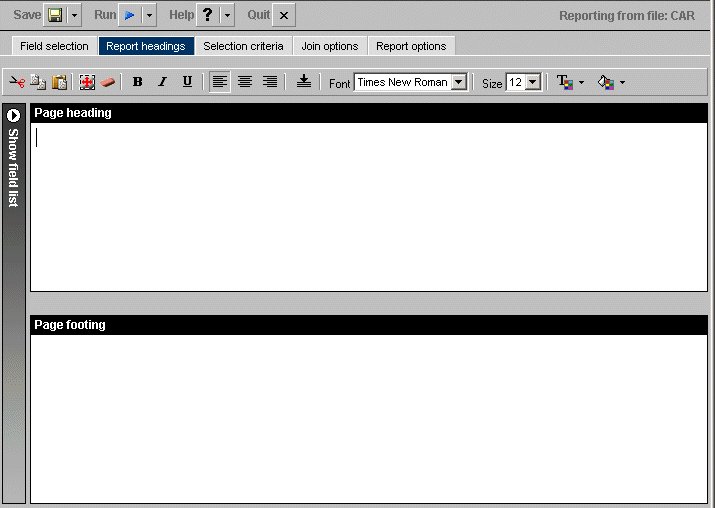
The following image shows the Report headings tab opened with a formatting tool bar, the Page heading and the Page footing text boxes.
Dragging and dropping items, including images, is not supported in the Report Assistant.
Add and Align a Heading in a Report
- In the Report headings tab, click in the text box or press Alt+H to enter a page heading title.
- Click the Center icon to center the heading in the report. The heading is left-aligned by default.
Add and Align a Footing in a Report
- In the Report headings tab, click in the text box or press Alt+F to enter a page footing title.
- Click the Center icon to center the footing on the report. The footing is left-aligned by default.
- Click the Bottom icon to place the footing at the bottom of the report.
Include a Field in a Heading or Footing
You can include a specified field in a heading or footing. When you run the report, the data value for the field will be included in the heading or footing.
- Click the Show fields list icon to the left of the Report headings box to display the Available fields window.
- Select a field from the Available fields window and drag the field to the Page heading or Page footing box.
or
Click and hold the left mouse button, and drag the field to the fields box you chose.
or
Use the shortcut keys to quickly go to one of the field boxes.
In the following table, the first column (Field Box) describes where you go when you use the shortcut key combination described in the second column (Shortcut Keys).
Field Box
Shortcut Keys
Page Heading
Alt+H
Page Footing
Alt+F
Press Alt+M to go to the Available Fields window, tab to the field and press Enter to add the chosen field in the page heading or footing text box.
- You can add more than one field name to either the Page heading or Page footing box by selecting one field at a time.
- The report's heading or footing will contain the first value retrieved for the field in the heading or footing.
Style a Heading or Footing
To style a heading or footing:
- Select the field you want to style in the Page heading or the Page footing text box in the Report headings tab.
- Click the Cut, Copy, Paste, Select all, and Remove formatting icons to format the text of your choice.
- Click the appropriate icons to bold, italicize,
or underline your text.
- Click the icons for left, center, or right alignment to specify justification.
- Click the Bottom icon to move your text to the bottom of the report.
- Click the Font list box or press Alt+N to specify your selections.
When selecting a font, be sure to click in the text box before you select the font name, otherwise the font may return to the original font selection.
- Click the Font Size list box or press Alt+S to specify your selections.
- Click the Text Color icon or press Alt+C and Enter to open the Color palette window. Choose a color from the color list.
- Click the Background Color icon or press Alt+B and Enter to open the Color palette window. Choose a color from the color list.
- Click Save or Save As to save your settings.
The default styling settings are as follows:
- Font: Times New Roman
- Size: 13 (If you change the font size of your heading, which is a FOCUS title, the code may not properly reflect the font size you specified when you open the procedure in a text editor. This does not affect functionality. You can edit the procedure manually to correct the size.)
- Style: Normal
- Text Color: Black
- Background Color: Transparent
- Justify: Left
Selecting Records for a Report
When generating a report and specifying which fields to display, you may not want to show every instance of a field. By including selection criteria, you can display only those field values that meet your needs. In effect, you can select a subset of the data, which you can easily redefine each time you issue the report request.
When developing a report request, you can define criteria to select records based on:
- The values of an individual field (using a Where statement).
- The aggregate value of a field, for example, the sum or average of a field's values (using a WHERE TOTAL statement).
The Selection criteria tab enables you to create Where or Where Total statements for record selection.
Creating a Where or Where Total Statement
Where and Where Total statements enable you to display only those records that pass your selection criteria. These statements select the data source records to be included in a report. The data is evaluated according to the selection criteria before it is retrieved from the data source. Use the Selection criteria tab to create a new Where or Where Total statement.
In the Report Assistant, when you create a Where statement in the Selection criteria tab for a range of dates using FROM - TO, you will not be alerted if the TO field is chronologically before the FROM field. For example, if you enter something like "from 12/31/05 to 1/1/05", there will be no records in the resulting report.
Select Records Based on Values, Parameters, Fields, or a Constant
- In the Report Assistant, click the Selection criteria tab.
- Select a field from the Available fields window and drag the field to the Screening conditions pane.
or
Press Alt+M to go to the Available Fields window, tab to the field and press Enter to add the chosen field.
The field name and Equal to and Select values appear in the Screening conditions pane.
- Select WHERE or WHERE TOTAL.
- Select an operator from the drop-down list (for example, Equal to)
in the right pane.
- Click Select values to complete the expression.
- Select one of the following compare type option buttons:
- Constant. Enter a value that will serve as a constant (a value that will not change). For example, enter vehicle.
After you click OK, the constant, vehicle, appears in the WHERE statement which reads BODYTYPE Equal to vehicle.

- Parameters. Enter the name of the variable.
For example, moped as shown in the following image with the Parameter option button selected and the variable name entered as moped.
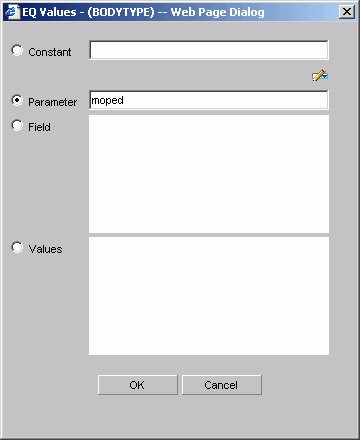
You can set parameter properties, for details see Setting Parameter Properties.
After you click OK, the parameter, &moped, appears in the WHERE statement which reads BODYTYPE Equal to &moped.

The ampersand is automatically added by DB2 Web Query.
- Fields. Select a field from the list.
After you click OK, the field BHP appears in the Where statement which reads CAR.COMP.CAR Equal to CAR.SPECS.BHP.

- Values. Select a value for the field you initially chose (in this case, car).
After you click OK, the value, Audi, appears in the Where statement which reads CAR.COMP.CAR Equal to AUDI.

- Constant. Enter a value that will serve as a constant (a value that will not change). For example, enter vehicle.
Create a Where Statement Using Date and Time Values
- Click the Selection criteria tab.
- Select a field from the Available fields window and drag the field to the Screening conditions pane.
or
Press Alt+M to go to the Available Fields window, tab to the field and press Enter to add the chosen field.
- Click Equal to in the right pane to display a list of operators. Click the operator of your choice.
- Click Select values to complete the expression.
- Click Field to access date and time values for that field. For example, EYEAR.
- Click Values and click the value of your choice. For example, 1989/01/18.
After you click OK, the value, 1989/01/18, appears in the WHERE statement which reads START_DATE Equal to 19890118.

Importing Values From External Files for WHERE Statements
When developing a query, you can use a locally saved, external file as selection criteria to limit query results. This enables you to quickly build a query containing a large number of WHERE statement values without having to manually enter repetitive or readily available data.
Create a Value List From an External File
- Required: Navigate to the Selection criteria area.
- Required: Begin creating a WHERE statement by selecting a field from the list of available fields.
- Required: Select a data comparison option that can accept multiple values.
Valid options include EQUAL to, NOT EQUAL to, IN literal list, NOT IN literal list, EXCLUDES literal list, and INCLUDES literal list.
- Click Select values.
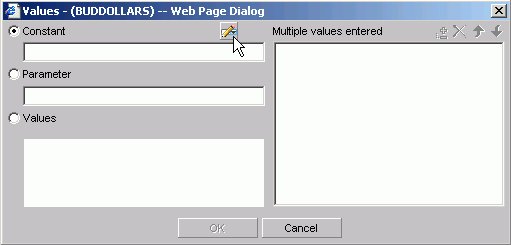
The Values dialog opens.
- Click the import button as shown in the following image.
A dialog box opens as shown in the following image.
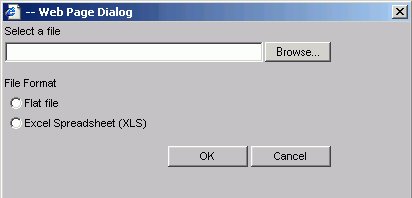
- Select either the Flat file or Excel Spreadsheet (XLS) File Format option.
- Click the Browse button.
A standard file selection dialog opens.
- Select an external file to import from your local machine or network.
The external file must only contain text with new line delimiters.
- Click OK.
The values contained in the file are displayed in the Multiple values entered list in the right pane of the dialog.
- Optionally,
you can remove specific values from the Multiple values entered list or move values up or down within the list.
- Click OK.
You can save the query for future use and reopen the query to append new or remove existing values.
Setting Parameter Properties
When you create parameters for Selection Criteria (WHERE statements) you can set the properties for the parameter. For example, you can create a dynamic or static list of values to choose from at run time.
Set Parameter Properties
- In the Report Assistant, click the Selection criteria tab.
- Create a WHERE or WHERE TOTAL expression.
- Select an operator. Some operators are not supported with the Variable Editor, see Supported Operators for the Variable Editor for details.
- Click Select values.
- Select the Parameter option button.
- Click the Auto Prompt button.
The Parameter Properties dialog box opens.
- Choose the Selection type, Dynamic or Static.
The Dynamic option is selected by default.
The Name and Description fields are automatically populated based on the field you are screening on, but you can edit the populated values.
The Description field cannot contain a period (.) because a period is the delimiter to specify the beginning and end of the description value.
- Set the parameter values. For the:
- Dynamic selection type, the Data Source and Field are selected by default based on the field you are screening on. You may change these as necessary.
- Static selection type, select the Constant or Show field values option button. For constant, enter a value or values. For Show field values, all of the values for the selected field appear in the list box. Move the values you want in the selection list to the Prompt values list.
- Dynamic selection type, the Data Source and Field are selected by default based on the field you are screening on. You may change these as necessary.
- Click OK to exit the Parameter Properties dialog box.
Supported Operators for the Variable Editor
|
Operator |
Enabled for the Variable editor? |
|---|---|
|
Equal to |
Yes |
|
Not equal to |
Yes |
|
Equal to multiple |
No |
|
Not equal to multiple |
No |
|
Greater than |
Yes |
|
Less than |
Yes |
|
Greater than or equal to |
Yes |
|
Less than or equal to |
Yes |
|
In literal list |
No |
|
Not in literal list |
No |
|
Missing |
No |
|
Not missing |
No |
|
From - to |
No |
|
Not-from - to |
No |
|
Includes literal list |
No |
|
Excludes literal list |
No |
|
Contains characters |
Yes |
|
Omits characters |
Yes |
|
Like character mask |
Yes |
|
Not like character mask |
Yes |
Combining Expressions
Use the right pane of the Selection criteria tab to use or delete existing Where statements and to combine expressions.
Combine Expressions
- Create an expression.
- When you create additional expressions,
they are combined with the default operator AND as shown in the following image with two statements, the first a WHERE and the second an AND statement.
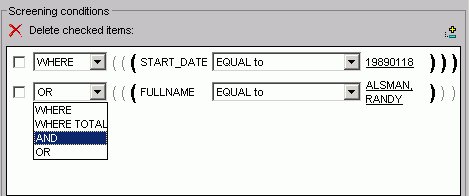
- Toggle between AND, OR, WHERE, and WHERE TOTAL by clicking the AND to make your choice.
Delete an Active Expression
- Select the check box next to the expression you want to delete. Click the Delete icon above the box.
- You are prompted to delete the expression. Click OK to delete.
Grouping Expressions Together With Parentheses
You can use parentheses to group expressions together to optimize the Where statement.
Group Where Statements Together Using Parentheses
Click the grayed out parentheses to activate the parentheses and group expressions together.
Limiting Data With Filters
Filters enable you to quickly select predefined criteria that limit data included in a report. Filters are selection criteria (Where statements) that an Administrator creates for you to apply as needed, without having to create your own selection criteria.
DB2 Web Query displays filters in filter groups. Each filter group can contain multiple filters. Selecting a single filter within one group creates a report with simple filtering criteria. By selecting multiple filters within a group or combining filters from different groups, you can create complex filtering expressions.
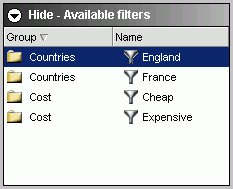
The following image shows a few sample filters as they appear in the Selection criteria tab of the HTML Report Assistant. They are listed by Group and Name.
Simple Filtering Criteria
Simple filtering criteria consists of one or more filters from the same filter group. If you select only one filter, the data must match that filter to be included in the report. If you select multiple filters from the same filter group, the data must match only one filter to be included in the report. This type of criteria is an OR criterion.
Complex Filtering Criteria
Complex filtering criteria consists of one or more filters from multiple filter groups. Data must match one filter from each filter group to be included in the report. This type of criteria is an AND criterion.
Selecting Records With LIKE and NOT LIKE Operators
Alphanumeric fields include the following operators:
- LIKE the character mask. This means that the value for the field you selected will be included in the report. All other values for that field will not be included in the report. For example, if you select the Plant field and specify Boston with LIKE the character mask,
only values for Boston will appear in the report. Values for plants in all other locations will not be included.
- NOT LIKE the character mask. This means that all values except the one you specify for the field you selected will be included in the report. For example, if you specify Boston with the NOT LIKE character mask, data for Dallas, Los Angeles, New Orleans, Seattle, and St. Louis will display and no data will display for Boston.
These operators generate the appropriate LIKE and NOT LIKE expressions using the character mask available in the expressions list when creating a WHERE statement.
Working With Joins
A join is a temporary connection between two or more data sources that share at least one common field. Once you join two data sources, each time DB2 Web Query retrieves a record from the first data source (host file), it also retrieves the matching records from the second data source (target file).
You use the Join tool to link data sources in both Report Assistant and Graph Assistant. The Join tool provides a graphical method for creating and manipulating joins. You can also create define-based joins and multi-field joins.
When you access the Join tool, the window displays a field list for the host data source (which you specified when you created the report), and a field list for any target data source you add to the window.
Create a Join
- Click the Join options tab in Report Assistant or Graph Assistant and click New.
The DB2 Web Query masters list dialog box opens where you select a target data source.
- Select a data source and click OK.
The following image shows the Join settings window where you select fields from the Host field and the Target field lists to create a join.
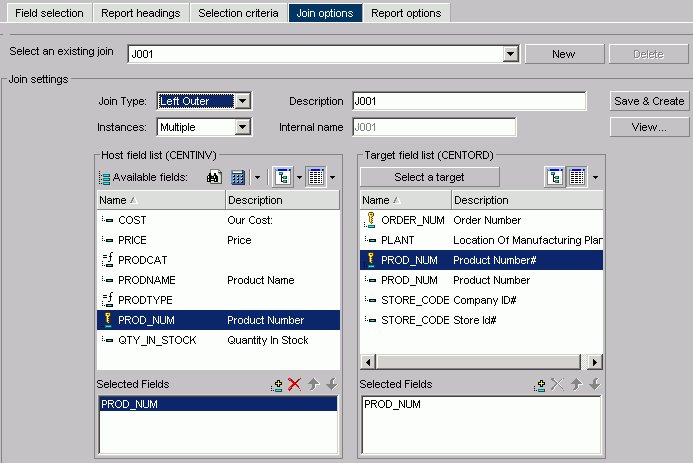
- Select the fields you want to join from the Host field list and the Target field list and add them to their respective Selected Fields boxes.
or
Press Alt+M to go to the Host field list.
or
Press Alt+T to go to the Target field list.
Then, tab to the field and press Enter to add the chosen field to the corresponding Selected Fields box.
Fields must have the same format and be indexed fields in order to use them to create joins.
- Select your join properties:
- Unspecified. Indicates neither an inner nor left outer join.
- Inner Join. A join that results when a report includes host rows that have corresponding cross-referenced rows.
- Left Outer Join. Extends the results of an Inner Join and retrieves records from both host and cross-referenced tables, including all records from the left table (host) and any records from the right table (cross-referenced) where the condition values match. If there are no matching values in the cross-referenced table, the join still retrieves records from the host table.
- Multiple Instance (formerly Non Unique). A one-to-many join structure that matches one value in the host data source to multiple values in the cross-referenced field. Joining employee ID in a company's employee data source to employee ID in a data source that lists all the training classes offered by that company would result in a listing of all courses taken by each employee, or a joining of the one instance of each ID in the host file to the multiple instances of that ID in the cross-referenced file. The default join type is inner.
- Single Instance (formerly Unique). A one-to-one join structure that matches one value in the host data source to one value in the cross-referenced data source. Joining an employee ID in an employee data source to an employee ID in a salary data source is an example of a unique join.
- Unspecified. Indicates neither an inner nor left outer join.
- To see the join syntax, click View.
- Click OK.
- In the Description box, give the join a meaningful and unique name.
- Click Save &
Create.
The new join appears in the Joins list.
Create a Define-based Join
- Click the Join options tab in Report Assistant or Graph Assistant and click New.
The DB2 Web Query masters list dialog box opens where you select a target data source.
- Select a data source and click OK.
- Click the down arrow of the Define icon and then click New define field.
The following image shows the list of Define field options.

The following image shows the Define field creator dialog box where you create the Define expression.

- Create the defined field. The new define field appears in the Available fields list. The field is prefixed with the define
 symbol.
- Add the defined field and the target field to their respective Selected Fields boxes.
Fields must have the same format and be indexed fields in order to use them to create joins.
- If you want to see the syntax, click View to display the define-based join syntax.
- Give the join a meaningful and unique name in the Description box.
- Click Save & Create. The new join appears in the Joins list.
Create Multi-field Joins
- Click the Join options tab in Report Assistant or Graph Assistant and click New.
The DB2 Web Query masters list dialog box opens where you select a target data source.
- Select a data source and click OK.
- Enter multiple fields in the Host field list box and one field in the Target field list box.
- If you want to see the syntax, click View to display the multi-field join syntax.
- In the Description box, give the join a meaningful and unique name.
- Click Save &
Create.
The new join appears in the Joins list.
Delete a Join
Edit a Join
- Select a join from the Select an existing join list box.
- Make your desired changes.
- Click Save & Create.
Applying Other Report Options
The Report options tab enables you to select from a variety of options for the output of your report.
The features of the Report options tab are shown in the following image.
The following is a list of the Report options tab features:
- Save a report to an output format that supports styling options.
- Save a report to an output format that supports CSS.
- Specify the page-numbering format.
- Set record/read limits.
- Use database optimization.
- Enter a report title.
- Enter summary text.
- Style the entire report.
- Style a PDF or PS report.
- Justify an entire report.
- Enable On-demand Paging and grid lines.
- Display pop-up field descriptions for column titles.
- Optimize output with internal Cascading Style Sheets (CSS).
- Run long queries with the Paged option.
- Create a DB2 file as report output.
- Use accessibility features.
- Enable OLAP features.
- Enable the Automatic Drill Down features.
- Direct output to a printer.
Save a Report to an Output Format That Supports Styling Options
- From the Report options tab,
select the Show styled formats option from the drop-down list.
- The Generate report as list box offers a choice of file types for the report output. Select one of the following formats from this list:
- HTML. Creates the report in HTML, sending the output to the Web browser, with or without grid lines.
- AHTML (Active Report). Creates an HTML report that is designed for offline analysis. Users can interact with the data, using analysis options similar to those found in an Excel workbook, without any connection to a server. See Creating an HTML Active Report.
- PDF. Captures the entire report and creates a Portable Document Format (.PDF) file, which can be opened in the Adobe® Acrobat Reader (Adobe's PDF viewer).
- EXL97. Generates a report in Excel97 format.
- EXL2K. Generates fully styled reports in the Excel 2000 HTML format. Excel 2000 provides full support for HTML files with embedded XML.
- EXL2KFORMULA. Excel with Formula.
- PS. Creates the report as a postscript file.
- HTML. Creates the report in HTML, sending the output to the Web browser, with or without grid lines.
Save a Report to an Output Format That Supports CSS
- From the Report options tab,
select the Show unstyled formats option from the drop-down list.
- The Generate report as list box offers a choice of file types for the report output. Select one of the following formats:
- EXCEL. Excel 95.
- DOC. Plain text with page breaks.
- WP. Plain text without page breaks.
- WK1. Import to Lotus® 1-2-3®. See Notes on Using LOTUS Format..
- DIF. Import to Spreadsheet.
- LOTUS. Import to Lotus 1-2-3. See Notes on Using LOTUS Format.
- TABT. Tab delimited.
- XML. eXtensible Markup Language.
- EXCEL. Excel 95.
Specify Page Numbering Format
The Page Numbering list box offers several options for page numbering. Select one of the following from the list box:
- Default. Numbers each page of the report in the format PAGE 1, PAGE 2, and so on. The default value is ON.
- ON. Numbers each page of the report in the format PAGE 1, PAGE 2, and so on.
- OFF. Suppresses the display of page numbers.
- NOLEAD. Suppresses the two leading blank lines included on each page by default.
Set a Record Limit or Read Limit
To limit the number of records retrieved when reporting from a non-FOCUS data source, enter a number greater than zero in the Read Limit box. A read limit specification is ignored when reporting from a FOCUS data source.
To limit the number of records retrieved when reporting from a FOCUS data source, enter a number greater than zero in the Record Limit box.
These options are for development only.
- A warning is issued to indicate to the user that the report they are viewing is only a subset of the actual data. This occurs when either Record limits or Read limits are checked in the Properties tab, under Warning message displayed in Heading.
- The This report is only a subset of the data edit box is checked by default. You can deselect the check box for this message or design a new message. Either message will appear in the heading of the report.
Set Optimization When Running Requests
You can optimize report requests which will reduce the volume of database-to-server communication and improve response time. It also enables the database to exploit its own internal optimization techniques. This function creates SQL statements that take advantage of join, sort, and aggregation capabilities.
Select the Use Database Optimization check box to enable this function.
Include a Report Title
You can specify a report title in the Report Title field that will appear in the title bar of your report. This option is not available for reports generated in PDF or PS format or for reports that utilize on-demand paging.
Include Summary Text for a Report
You can specify summary text for your report in the Summary Text for Report field. This will place a description of the output into a SUMMARY object inside the output HTML TABLE. The length limit of this summary is 500 characters. If you try to set the SUMMARY to more than 500 characters, you receive the following message:
Limit on length of summary is 500 characters.
You can only specify summary text when the Use Accessibility features (Section 508) option is checked.
Style the Entire Report
- Click Font in the Global report styling section on the Report options tab.
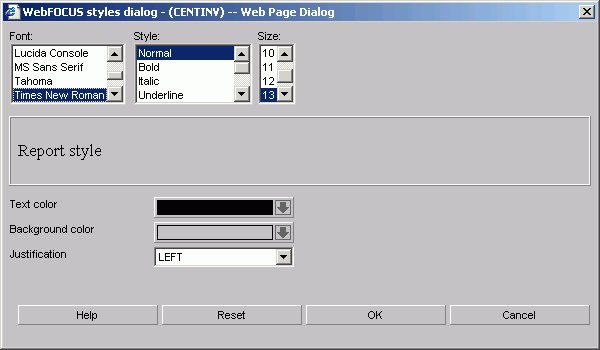
The Styles dialog box opens where you can select report style options.
- Select styling options from the Font, Style,
and Size boxes.
- Select a text color from the Text Color list box.
- Select a background color from the Background Color list box.
- Select a justification from the Justification list box.
- Click OK.
- To specify an existing DB2 Web Query Style Sheet or Cascading Style Sheet, make your choice from the relevant list box.
Clicking Reset returns the styling options to the following default settings:
- Font: Times New Roman
- Style: Normal
- Size: 13
- Text Color: Black
- Background Color: Transparent
- Justification: Left
Style a PDF or PostScript Report
When you select PDF or PostScript® (PS) as the display format for a report, DB2 Web Query offers several additional styling features.
- Select PDF or PS from the Generate report as list box.
- Click Font.
The Styles dialog box opens.
- Select a font.
- Click the Page Orientation list box to select either Portrait or Landscape.
This option is only available when you select PDF as the report format.
- Click the Page size list box to select the page size for the report.
This option is only available when you select PDF or PS as the report format.
- Click OK.
Justify an Entire Report
The following procedure describes how to justify an entire report. This affects headers, footers, fields, and field headings.
- Click Font.
The Styles dialog box opens.
- In the Justification list box, select Left, Right,
or Center.
- Click OK.
Enable On-Demand Paging and Grid Lines
- Select HTML - Web browser or HTML - Web browser (with grid) in the Generate report as list box.
The latter option provides grid lines that separate cells of data in your report.
You can only use On-demand Paging for reports that use the HTML format.
- Click the On-demand Paging check box.
- Save and run the report.
DB2 Web Query displays the first page of the report in the DB2 Web Query Viewer.
Optimize Output With Cascading Style Sheets
When you check Optimize output with Cascading Style Sheets in the Report options tab of Report Assistant, your report will reflect the styling options you select, and generate Internal Cascading Style Sheet code in the HEAD tag of HTML reports. This feature is available only if you select HTML in the Generate report as drop-down list.
Run Long Queries With the Paged Option
To display the first few pages of results prior to the completion of a long-running query, use the Paged option for HTML output. From the Report options tab, select the Format HTML Output check box, then select Paged from the drop-down list.

Output for summary reports will be finalized when the query is complete.
Create a DB2 File as Report Output
To create a DB2 file as report output, complete the following steps.
- From the Report options tab, select the Show database formats option from the format drop-down list.
- Accept the default value in the Generate report as list box, which is DB2- DB2 database table.
- In the Database Output section, supply values for the following options:
-
Destination Library - name of the library destination for the DB2 report file.
-
Name - name of the DB2 file.
-
- If overwrite an existing file,
select the Overwrite existing file check box.
When specifying to overwite an existing database file, the file will not be overwritten if the user does not have specific write authority to the file. A message will be displayed which says that the file already exists, even though overwrite was specified.
The following image illustrates the options for the DB2 database format.

Use the Accessibility Feature
If you check this box, the output will be 508 compliant. See Include Summary Text for a Report.
Setting OLAP Reporting Options
OLAP options are available in the Interactive options section of the Report options tab in Report Assistant only when the OLAP license option is activated. The relevant options—Enable OLAP and Automatic Drill Down—are located here.
Enable OLAP Options
The Enable OLAP options in the Report Assistant control how users can interact with an OLAP report and access OLAP tools.
Administrators and Developers who are creating reports can OLAP-enable them and control the following OLAP interfaces and drill down options.
- OFF. OLAP is off when off is selected, OLAP options are not available for the report.
- Columns only. Turns off the OLAP Control Panel and the OLAP Selections pane, but enables OLAP functionality from the report itself. You can access options on right-click menus, drag and drop columns within the report, and use up and down arrows to sort columns from high to low or vice versa. This is the default.
- Columns with panel. Provides access to the OLAP Selections pane from a square button to the left of the column titles.
- Show filters on top. Opens the OLAP Selections pane above the report. The Measures, Graph, and Dimension controls, as well as the band containing the OLAP, Run, and Reset buttons appear above the report output. You can open the Control Panel by clicking the OLAP button on the Selection pane.
- Show filters on bottom. Opens the OLAP Selections pane below the report. The Measures, Graph, and Dimension controls, as well as the band containing the OLAP, Run, and Reset buttons appear below the report output. You can open the Control Panel by clicking the OLAP button on the Selection pane.
- Show Panel in Report. Opens the OLAP report with the OLAP Selections pane hidden. You can perform a variety of analytic tasks from the report itself. Selection Criteria is shown next to the OLAP button.
- Show Tabbed. For OLAP reports that have multiple dimensions, this option groups the dimension elements under a tab labeled with the dimension name.
Automatic Drill Down Options
These options enable you to sort instantly from high to low or low to high for selected report columns:
- Off. Disables automatic drill downs.
- Dimensions only. Enables automatic drill downs on dimensions in reports and graphs.
- Measures and Dimensions. Enables automatic drill downs on dimensions in both reports and graphs and on measures in reports.
Direct Output to a Printer
To create a direct output to a printer, complete the following steps.
- From the Report Options tab, select the Send to printer check box.
As shown in the following image, the Printer name field becomes enabled when the check box is selected.
- Type the name of the printer you wish to print to in the Name field.
For example, CAN28B1 is the network printer typed in the Name field, as shown in the following image.

Displaying Pop-up Field Descriptions for Column Titles
You can have pop-up field descriptions display in an HTML report when the mouse pointer is positioned over column titles. Field description text displays in a pop-up box near the column title using the default font for the report. Pop-up text appears for report column titles including titles created with ACROSS phrases and stacked column titles created with OVER phrases.
The pop-up text displayed for a column title is defined by the Description attribute in the Master File for the corresponding field. If a column title has no Description entry in the Master File, then no pop-up box is generated when your mouse is positioned over the title.
This feature is not supported in the HTML Graph Assistant.
Display Pop-up Field Descriptions in an HTML Report
- Open the HTML Report Assistant.
- In the HTML Report Assistant window, select the Report options tab.
- In the Interactive Options area, select the Show pop-up field description check box.
- Click Save to save this option in your report.
Creating an HTML Active Report
Active Report functionality is available only when the Active Reports license option is activated.
An HTML Active Report is a report that is designed for offline analysis.
When using an HTML Active report you can:
- Interact with the data, using analysis options similar to those found in an Excel workbook,
without any connection to a server.
- Work offline without any additional plug-ins or programs. HTML Active Reports are self-contained reports, meaning they contain all of the data and JavaScript™ within the HTML output file. Packaging the data and the interactive functions in the HTML file also makes the output highly compressible for e-mail and transparent to security systems.
- Save the report on a local machine with the packaged interactivity. Since no connection to a server is required to view the data or use the analysis options, you can save and use the report anywhere.
The following image shows a simple HTML Active Report. The record status and page navigation bar appears at the top of the report.
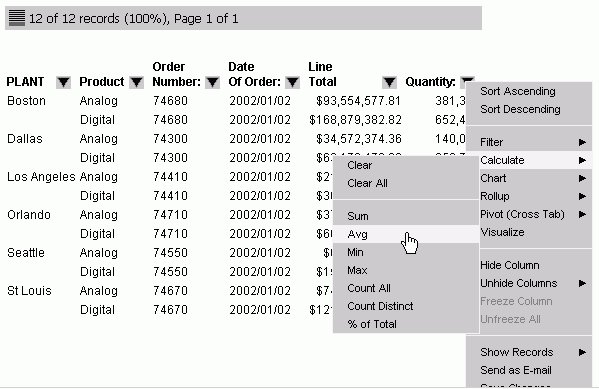
Create an HTML Active Report With HTML Report Assistant
- In the HTML Report Assistant, click the Report options tab.
- Ensure that the Show styled formats option is selected from the drop-down list.
- From the Generate report as drop-down list,
select AHTML - Active Report.
- Click the Active Report Styling button.
- Select options for the Active Report.
Formatting an HTML Active Report
You can apply the following custom formatting to an HTML Active Report:
- Report view. You can set the report view as a standard table or as an expandable report. An expandable report is a collapsed report that can be fully expanded for sorting and other purposes.
- User type. You can set the user type, which determines the level of functionality and interactivity available in the report output. Each user type can be customized.
- Pagination. You can set the justification for the information that appears in the record status and page navigation bar and set the number of records that appear per page. Pagination options are not available for expandable report views.
- Calculations. You can set certain calculations for fields in the report. You set calculation results to show in a row that appears either above or below the report.
- Color. You can set the color for data visualization graphs, the text and background for the record status and page navigation bar, selected rows, the value and background for calculations, and the text,
background, and border for the menu.
- Freeze columns. Enables you to freeze the report at a particular point so that columns to the left of the freeze point remain in view while the user scrolls through the other report columns.
Active Report Styling Dialog Box
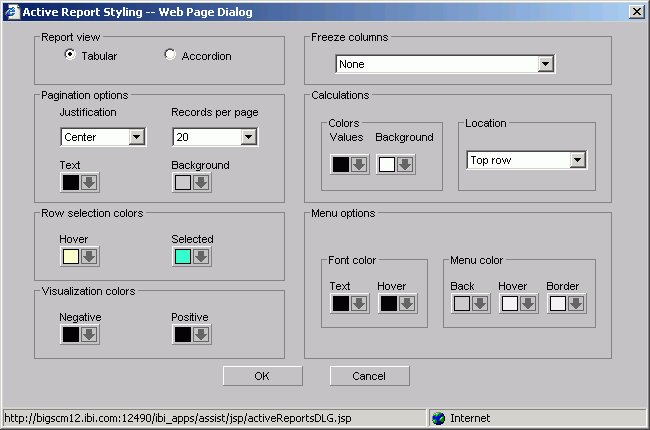
The Active Report styling options are:
- Report view
-
Sets the report view as a standard table (Tabular) or as an accordion report. Users can fully expand accordion reports for sorting and other purposes.
- Pagination options
-
Following are the pagination options for HTML Active Reports. Pagination options are not available for Accordion report views.
- Justification
-
Justifies the text that appears in the record status and page navigation bar. Options are Left, Center, and Right. Left is the default.
- Records per page
-
Sets the number of records that appear per page. Options are: Default, 10, 20, 30, 40, 50, Show All. The default is 57 lines per page.
- Text
-
Sets the color for the text in the record status and page navigation bar. The default is black.
- Background
-
Sets the background color for the record status and page navigation bar. The default color is silver.
- Row selection colors
-
An HTML Active Report offers visual assistance for viewing data in the report. For example, when a user hovers over a row of data the row is highlighted with a background color and when they click a row of data it is also highlighted with a background color. You can set the colors for these options, Hover and Selected. The default color for Hover is RGB(255 252 204), which is a shade of yellow, and the default color for Selected is RGB(51 255 204), which is a mix of green and blue.
- Visualization colors
-
Users can apply data visualization to numeric fields in an HTML Active Report. Here you can designate the colors of the bars. You can set different colors for positive and negative values. The default color for positive and negative values is black.
- Freeze columns
-
Enables you to freeze the report at a particular point so that columns to the left of the freeze point remain in view while the user scrolls through the other report columns. Options include:
- Calculations
-
Set options for calculations:
- Colors
-
Specifies the colors for the values in a calculation:
Values sets the font color of the calculation results. This color defaults to black.
Background sets the background color of the calculation results. This color defaults white.
- Location
-
Sets the location of the calculations. Options are Top row or Bottom row. Top row is the default.
- Menu options
- Set options for the menu.
- Font color
-
Enables you to set the colors for the menu text:
- Text sets the color of the text
-
The default is black.
- Hover sets the color of the text when the mouse hovers over it
-
The default color is black (text hover does not show).
- Menu color
-
Set the colors for the menu:
Background sets the background color of the menu. The default color is silver.
Hover sets the background hover color of an individual item on the menu. For example, if the background color of the menu is black, the hover color can be set to white to visually show which option on the menu the mouse is currently hovering over. The default color is white.
Border sets the color of the menu border. The default color is white.
Running a Report
You may periodically run a report as you create it as well as when you have finished creating it.
Run a Report
- Click the Run icon in the Report Assistant.
If you click Run, the report appears in a separate browser session.
- To return to the Report Assistant, close the browser window displaying the report.
You can continue to make changes to your existing report procedure or create another report by clicking Save As.
Saving a Report
When you click the Save or Save As buttons you save your report (procedure). If you make changes in your report without subsequently saving them and then click Quit, you are prompted with the following options:
- Yes. Click to save your changes and exit the report.
- No. Click to discard your changes and exit the report.
- Cancel. Click to return to your report to continue working or use Save or Save As to save your changes and then click Quit to exit your report.
Editing a Report
When you create a report using Report Assistant and you add a new comment as the first line of the report code, the report no longer opens in Report Assistant. Instead, the report opens in the Editor.
When there is an error in a procedure that HTML Report Assistant cannot identify, the code in the procedure appears in a window. At the top of the window, a message appears that describes what line of code the error is occurring on. You must reopen the procedure in the editor and correct the error before the procedure can be reopened in HTML Report Assistant.
HTML Report Assistant Tab References
The topics in this section provide reference information for all of the fields in the various tabs in the HTML Report Assistant.
Field Selection Tab
The Field selection tab is used to select fields for a report.
Field Selection Tab: Available Fields Window
The following image shows the Available fields window on the Field selection tab. The fields are sorted by the Name column with corresponding columns containing their Alias, Format, and Segment information.
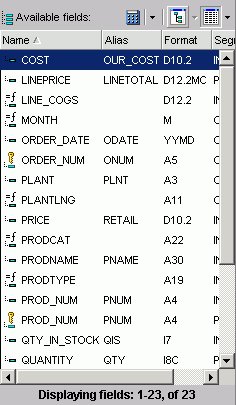
- Available Fields Window
-
Displays a list of field names from the selected data source.
- Define icon
-
Click the Define (calculator) icon to select: New define field, Edit define field, or Delete define field. If you select the New define field or Edit define field, the Define field creator dialog box opens where you can create or edit a defined field.
The New define field is not for use with queries originated in IBM Query/400.
- Tree icon
-
Displays a tree structure of field names by segment with segment, alias, title, description, and format information below the tree. Individual field information appears when you click on the field.
- List icon
-
Displays a list of all field names with information that you select from the adjacent arrow that opens a list box: name, alias, title, format, description, segment, and file name. You can also choose to sort by file order.
Field Selection Tab: Report Fields Window
The following image shows the Report fields section on the Field selection tab. You can view the selected fields with the following options:
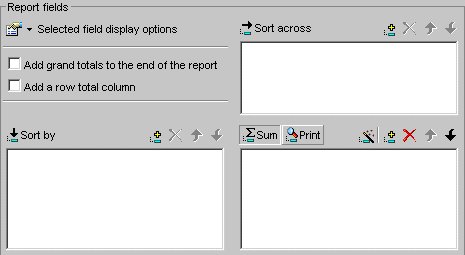
- Selected field display options
-
Lists the following field display options:
- Prefix with the Segment Name
-
Prefixes the field name with the segment name.
- Prefix with the Filename
-
Prefixes the field name with the name of the data source.
- Show the field's alias instead of name
-
Uses the alias defined in the Master File as the field name.
- Show field's title
-
Uses the title in the Master File instead of the field name.
- Show field's description
-
Uses the description in the Master File instead of the field name.
- Add grand totals to the end of the report
-
Displays the total for each column.
- Add a row total column
-
Displays the total for each row.
- Sort By
-
Lists the vertical field that you have selected from the Available Fields window.
- Add icon
-
Adds a field to the Sort By window.
- Remove icon
-
Removes a field from the Sort By window.
- Move Up or Move Down icons
-
Moves the position of the field within the report.
- Sort Across
-
Lists the horizontal field you have selected from the Fields window.
- Add icon
-
Adds a field to the Sort Across window.
- Remove icon
-
Removes a field from the Sort Across window.
- Move Up or Move Down icons
-
Moves the position of the field within the report.
- Sum
-
Indicates a report that aggregates data by the horizontal field.
-
Prints each value on a record-by-record basis.
- New Computed Field icon
-
Opens the Computed Field Creator dialog box where you can define the parameters for a new computed field. For more information on the Field Creator dialog box, see Field Selection Tab: Field Creator Dialog Box.
- Add icon
-
Adds a field to the report fields.
- Remove icon
-
Removes a field from the report fields.
- Move Up or Move Down icons
-
Moves the position of the field within the report.
Field Selection Tab: Field List Searching
The following image shows the Field List Searching options that you can use to search for a field in the Fields List. For more details, see Searching Field Lists.
- Pattern Search
-
Select the Master File attribute for which you want to search. The following table lists the pattern attributes and a description of each.
Attribute
Description
Name
Name of the field.
Alias
Alias for the field.
Title
Display title for the field, as defined in the Master File.
Format
Field format, for example A4.
Description
Field description, as defined in the Master File.
Segment
A segment of fields in the Master File.
Filename
Name of the data source.
- Text Box
-
Type your search string. You can use an asterisk (*) as a wildcard. For example, type c* to find all fields that begin with the letter "c". The character string is not case sensitive.
Field Selection Tab: Show Report Field Options for Sort By
The following image shows the Show report field options where you choose various styles and functions for a selected field.
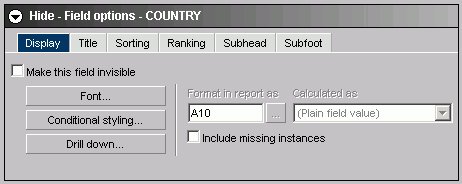
The Display subtab for a Sort by field has these options:
- Make this field invisible
-
Check to hide the display of a Sort By field.
- Font button
-
Opens the font styling dialog box. See Font Dialog Box.
- Conditional Styling button
-
Opens the conditional styling dialog box where you use to add conditional styling in a report.
- Drill Down button
-
Opens the drill-down dialog box. See Drill Down Dialog Box.
- Format in report as
-
Is grayed out and unavailable.
- Calculated as
-
Is grayed out and unavailable.
- Include missing instances
-
Inserts '.' when no field value exists.
The Title subtab for a Sort by field has this option:
- Title
-
Is the name of the field in the Sort By list box.
The Sorting subtab shown in the following image for a Sort by field has these options:
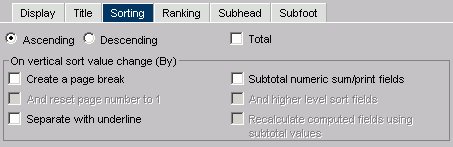
- Ascending
-
Click to arrange fields in ascending order.
- Descending
-
Click to arrange fields in descending order.
- Total
-
Applies aggregation and sorting simultaneously to numeric columns in your report in one pass of the data. See Aggregating and Sorting Fields.
- On vertical sort value change (By)
-
- Create a page break (on value change).
- Separate (from next) with underline.
- Subtotal numeric sum/print fields.
- When the "Create a page break" check box is selected, the "And reset page number to 1" check box is activated.
- When the Subtotal numeric sum/print fields check box is selected, the Subtotal tab appears and two more check boxes are activated; And higher level sort fields and Recalculate computed fields using subtotal values. For more information about subtotals, see Include Subtotals.
- Create a page break (on value change).
The Ranking subtab, shown in the following image for a Sort by field has these options:
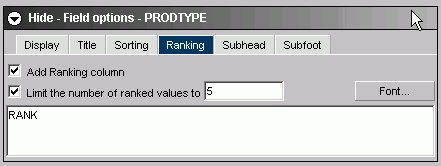
- Add Ranking column
-
This check box is unselected by default and enables a user to add a Ranking column.
- Limit the number of ranked values to
-
This check box is grayed out by default and activated only if the Add Ranking column check box is selected. It enables a user to enter an integer value to select the number of ranked values to display in the report (5 is the default value).
- Text Box
-
The title of the ranking column can be changed from the default of RANK.
- Font button
-
Opens the font styling dialog box. See Font Dialog Box.
The Subhead/Subfoot subtab, shown in the following image for a Sort by field has these options:
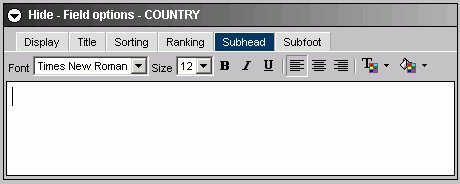
- Formatting toolbar
-
Specify the font, font size, font style, text alignment, text color, and background color of the subhead or subfoot.
- Text box
-
Enter a subhead/subfoot in the text box.
The Subtotal subtab for a Sort by field has:
- Text box
-
Enter text to display for the subtotal.
This sub tab appears when you select the Subtotal numeric sum/print fields option on the Sorting sub tab.
Field Selection Tab: Show Report Field Options for Sort Across
The following image shows the Show report field options where you choose various styles and functions for a selected field.
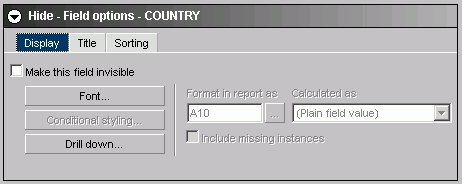
The Display subtab for a Sort across field has these options:
- Make this field invisible
-
Check to hide the display of a Sort Across field.
- Font button
-
Opens the font styling dialog box. See Font Dialog Box.
- Conditional Styling button
-
Is grayed out and unavailable.
- Drill Down button
-
Opens the drill-down dialog box. See Drill Down Dialog Box.
- Format in report as
-
Is grayed out and unavailable.
- Calculated as
-
Is grayed out and unavailable.
- Include missing instances
-
Is grayed out and unavailable.
The Title subtab for a Sort across field has this option:
- Title
-
Is the name of the field in the Sort Across list box.
The Sorting subtab for a Sort across field has these options:
- Ascending
-
Click to arrange fields in ascending order.
- Descending
-
Click to arrange fields in descending order.
Other options are grayed out and unavailable.
Field Selection Tab: Show Report Field Options for Column
The following image shows the Show report field options where you choose various styles and functions for a selected field.
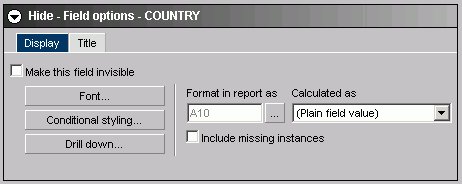
The Display subtab for a Column field has these options:
- Make this field invisible
-
Check to temporarily hide the display of a Column field.
- Font button
-
Opens the font styling dialog box. See Font Dialog Box.
- Conditional Styling button
-
Opens the conditional styling dialog box where you use to add conditional styling in a report.
- Drill Down button
-
Opens the drill-down dialog box. See Drill Down Dialog Box.
- Format in report as
-
Click ... to open the change format dialog where you can edit the field format. See Change Format Dialog Box.
- Calculated as
-
Make a selection from the drop-down list.
- Include missing instances
-
Inserts '.' when no field value exists.
The Title subtab for a Column field has this option:
- Title
-
Is the name of the field in the Columns list box.
Drill Down Dialog Box
The following image shows the drill down dialog box, where you can add drill down capability to a report.
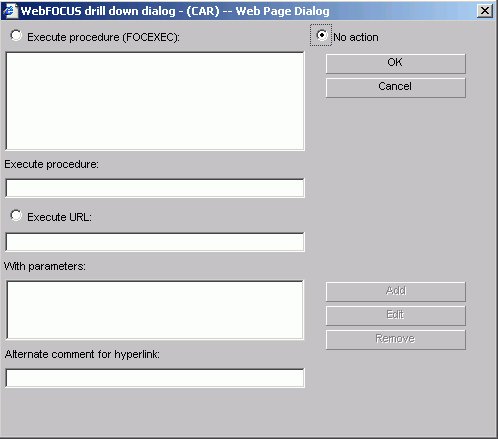
- Execute procedure (FOCEXEC)
-
Lists the domains and procedures that are available as drill-down reports. Click the procedure you want to execute.
- No action
-
Is the default.
- Execute procedure
-
The procedure you selected appears in this text box.
- Execute URL
-
Enter the URL of a Web page that will open when a user drills down.
- With parameters
-
Once a parameter is created using the Add button, it is automatically added to this area.
- Alternate comment for hyperlink
-
You can place comments here.
- Add button
-
Opens the drill-down parameter dialog shown in the following image.

- Parameter name
-
Enter the parameter name you created in the drill down procedure.
- Parameter value: Field
-
Select the field the user can drill down.
- Parameter value: Constant value
-
The parameter is set to the specified value.
- OK button
-
Returns to the drill down dialog. The parameter is added to the With parameters list box.
Font Dialog Box
The following images shows the font dialog box.
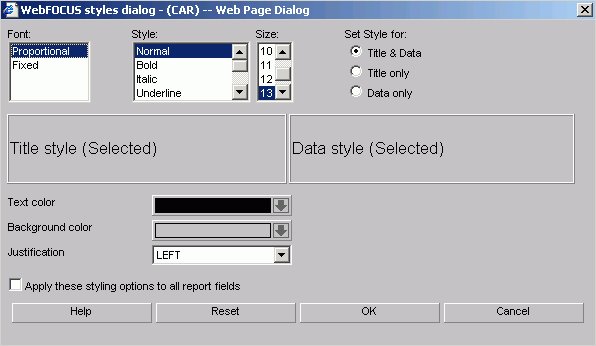
- Font
-
Select from the list box.
- Style
-
Select from normal or bold, italic, underline, and various combinations.
- Size
-
Select a font size from the list box.
- Set Style for Title & Data, Title only, or Data only option buttons
-
Set the style for Title & Data, Title only, or Data only.
- Text color
-
Select a color from the color palette.
- Background color
-
Select a color from the color palette.
- Justification
-
Select left, right, or center from the list box.
- Apply these styling conditions to all report fields check box
-
Apply these styling conditions to all report fields.
Field Selection Tab: Field Creator Dialog Box
Use the Field Creator Dialog Box to create or edit temporary fields, as shown in the following image.
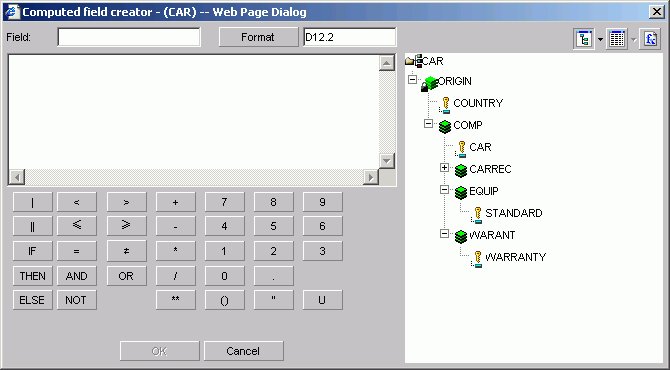
- Field
-
Enter a name for the temporary field. Note that field names cannot exceed 66 characters.
- Format button
-
Displays the Change Format dialog box where you can modify the data formats. See Change Format Dialog Box.
- Tree or List mode buttons
-
Opens the field list in either tree or list mode.
- Functions button
-
Displays a list of predefined functions.
- Fields window
-
Double-click a field or function to include it in an expression.
- Concatenation operators
-
Concatenates two or more alphanumeric constants and/or fields into a single character string. The concatenation operator has two forms: | (weak concatenation, which preserves trailing blanks) and || (strong concatenation, which moves trailing blanks to the end of a concatenated string).
- IF... THEN... ELSE... operators
-
Creates a conditional expression. A conditional expression assigns a value based on the result of a logical expression. The assigned value can be numeric or alphanumeric. IF, THEN, ELSE logic expressions take this form:
IF expression1 THEN expression2 ELSE expression3
ELSE is an optional operator. All alphanumeric values in conditional expressions must be enclosed in single quotation marks. For example, IF COUNTRY EQ 'ENGLAND'.
- Logical operators
-
Used to create relational and Boolean expressions. A relational expression returns a value based on a comparison of two individual values (either field values or constants) and a Boolean expression returns a value based on the outcome of two or more relational expressions.
-
 adds the less than (LT) operator to the expression. This operator returns a value if the value on the left is less than the value on the right.
-
 adds the greater than (GT) operator to the expression. This operator returns a value if the value on the left is greater than the value on the right.
-
 adds the less than or equal to (LE) operator to the expression. This operator returns a value if the value on the left is less than or equal to the value on the right.
-
 adds the greater than or equal to (GE) operator to the expression.
This operator returns a value if the value on the left is greater than or equal to the value on the right.
adds the greater than or equal to (GE) operator to the expression.
This operator returns a value if the value on the left is greater than or equal to the value on the right.
-
 adds the equal (EQ) operator to the expression. This operator returns a value if the value on the left is equal to the value on the right.
-
 add the not equal to (NE) operator to the expression. This operator returns a value if the value on the left is not equal to the value on the right.
- AND returns a value if both operands are true.
- OR returns a value if either operand is true.
- NOT returns a value if the operand is false.
-
- Arithmetic operators
-
Click any of the arithmetic operators to use them in your expression: + (addition), - (subtraction), * (multiplication), / (division), ** (exponentiation).
Two operators cannot appear consecutively. The following expression is invalid:
a* -1
To make it valid, add parentheses:
a* (-1)
- Parentheses
-
Adds parentheses to the expression box. Parentheses affect the order in which the specified operations are performed. For information on when to use parentheses, see Order of Evaluation for Expressions.
- Quotation Marks
-
Adds quotation marks to the expression box. Use single quotation marks to enclose alphanumeric and date literals.
- U option
-
Converts entries in the expression box to uppercase. Click the U key in the calculator. Note that field names are case-sensitive.
Order of Evaluation for Expressions
DB2 Web Query performs numeric operations in the following order:
- Parentheses.
- Exponentiation.
- Division and multiplication.
- Addition and subtraction.
When operators are at the same level, they are evaluated from left to right. Because expressions in parentheses are evaluated before any other expression, you can use parentheses to change this predefined order. For example, the following expressions yield different results because of parentheses:
COMPUTE PROFIT/D12.2 = RETAIL_PRICE - UNIT_COST * UNIT_SOLD ;
COMPUTE PROFIT/D12.2 = (RETAIL_PRICE - UNIT_COST) * UNIT_SOLD ;
In the first expression, UNIT_SOLD is first multiplied by UNIT_COST, and the result is subtracted from RETAIL_PRICE. In the second expression, UNIT_COST is first subtracted from RETAIL_PRICE, and that result is multiplied by UNIT_SOLD.gives an incorrect result because UNIT_SOLD is first multiplied by UNIT_COST, and then the result is subtracted from RETAIL_PRICE.
Change Format Dialog Box
The following image shows the Change Format dialog box.
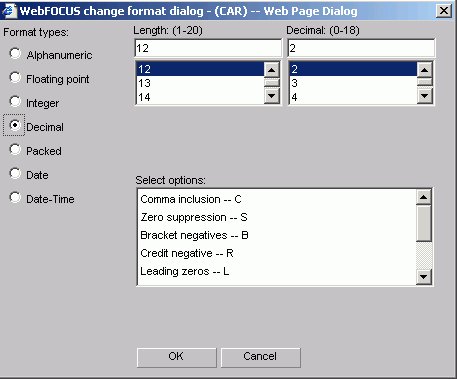
- Format types
- Length
-
Choose an available number based on the format type you chose.
- Select options
-
Choose options based on the format type you chose.
Report Headings Tab
The Report headings tab is used to select and style headings and footings for a report.
Report Headings Tab
The following image shows the Report headings tab where you enter and style a page title heading and/or footing. You can also include a field value from the Available fields list in the page heading and/or footing.
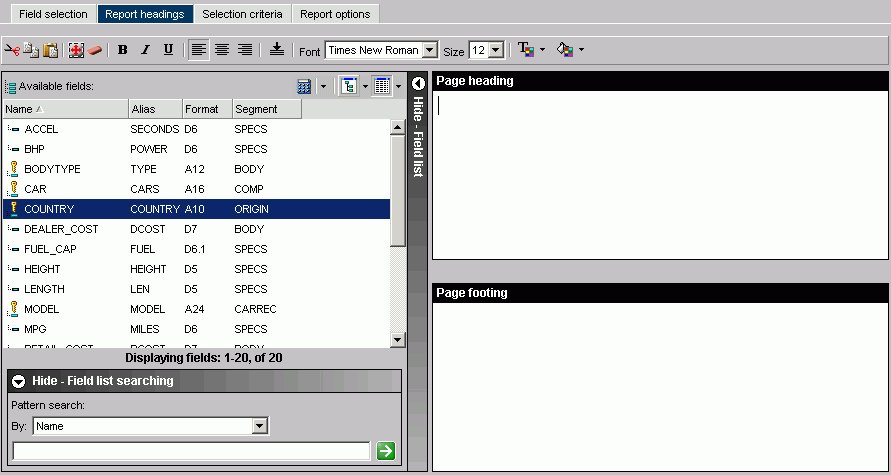
The above icons are not available for Firefox users. You must use the standard key combinations Ctrl+C, Ctrl+V, Ctrl+X, and so on.
- Font styles. Select from bold, italic,
and underline.
- Alignment.
Select left, center, right, or bottom alignment.
- Font. Select a different font from the list box.
- Font size. Select a font size from the list box.
- Text color.
Select the text color from the color menu.
- Background color. Select the background color from the color menu.
- Show/Hide Fields list
-
Show or hide the Available Fields window.
- Available fields window
-
Insert a field in your heading or footing from the fields list.
- Define icon
-
Click the Define (calculator) icon to select: New define field, Edit define field, or Delete define field. If you select the New define field or Edit define field, the Define field creator dialog box opens where you can create or edit a defined field.
- Tree icon
-
Displays a tree structure of field names by segment with segment, alias, title, description, and format information below the tree. Individual field information appears when you click on the field.
- List icon
-
Displays a list of all field names with information that you select from the adjacent arrow that opens a drop-down list: name, alias, title, format, description, segment, and file name. You can also choose to sort by file order.
- Page Heading
-
Enter the text for the heading in the Page Heading box.
- Page Footing
-
Enter the text for the footing in the Page Footing box.
Selection Criteria Tab
The Selection criteria tab is used to create WHERE and WHERE TOTAL statements for a report.
Selection Criteria Tab: Screening Conditions
The following image shows the Screening conditions section on the Selection criteria tab where you create a WHERE statement by dragging and dropping a field from the Available Fields window.

- WHERE/WHERE TOTAL
-
Use WHERE to select records based on the values of an individual field.
Use WHERE TOTAL to select records based on the aggregate value of a field, for example, the sum or average of a field's values.
- Fieldname
-
Is the field you initially chose.
- Operator Expression
-
Select an operator from the list box, for example, equal to.
- Select Values
-
Click to open the Values dialog box (shown in the following image) with the Parameter option button selected and a list of values for the CAR field.
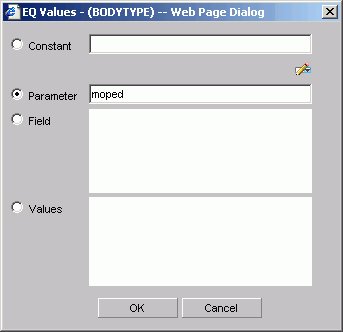
- Constant
-
Enter a constant.
- Auto Prompt button
-
Opens the Parameter Properties dialog box. See Parameter Properties Dialog Box (Dynamic Parameters) and Parameter Properties Dialog Box (Static Parameters).
- Parameter
-
Enter the name of the parameter.
- Field
-
Select a field from the Field list box.
- Values
-
Select a field from the Values list box.
Parameter Properties Dialog Box (Dynamic Parameters)

- Name
-
Name is the parameter name. This field is automatically filled in with information from the selected field. You can change the name if necessary.
- Description
-
Text that appears in the Auto prompt page as a prompt for the selection list. This field is automatically filled in with information from the selected field. You can change the description if necessary.
- Selection
- Select multiple values at runtime
-
Selecting this check box enables you to provide more than one value to the report from the auto prompt page. In addition, the user is able to select all values from the values list.
- Data Source
-
Select a data source that contains the values for the parameter. The data source must be on your APP PATH.
- Field
-
Select the field from the data source whose values will populate the selection list.
Parameter Properties Dialog Box (Static Parameters)
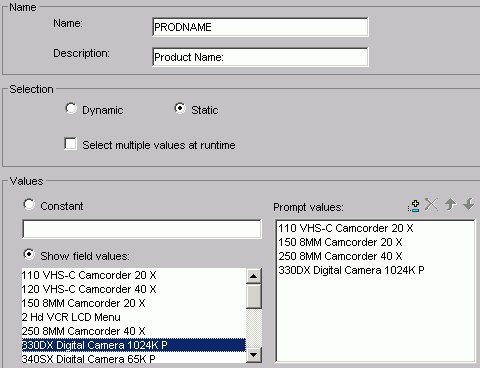
- Name
-
Is the parameter name. This field is automatically filled in with information from the selected field. You can change the name if necessary.
- Description
-
Text that appears in the Auto prompt page as a prompt for the selection list. This field is automatically filled in with information from the selected field. You can change the description if necessary.
- Selection
- Select multiple values at runtime
-
Selecting this check box enables you to provide more than one value to the report from the auto prompt page. In addition, the user is able to select all values from the values list.
- Constant
-
Enter a value or values.
- Show field values
-
Shows the values in the selected field. Move the values you want in the selection list to the Prompt values list.
- Prompt values
-
Prompt Values are the values that appear in the selection list. You can use the available buttons to add, remove, and change the order of the Prompt values.
Join Options Tab
The Join options tab is used to create joins for a report.
Join Options Tab: Add or New
The following image shows the Join options tab where you create joins for a report.
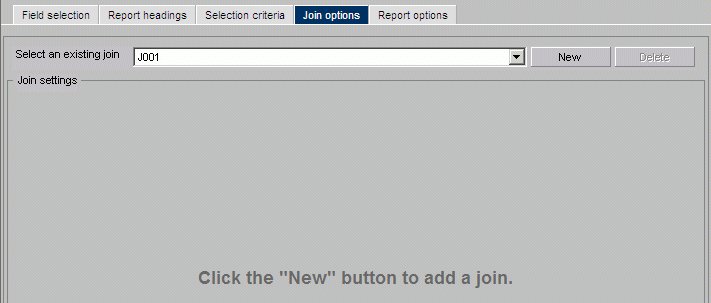
- Select an existing join
-
Use the list box to select the join with which you want to work.
- New
-
Opens the Masters List dialog box where you select the target data source.
- Delete
-
Click to delete the join.
- OK button
-
Click to select a Master File.
- Cancel button
-
Click to return to the Add/New Join window.
When you select a target data source you have multiple join related settings and options, as shown in the following image.
The Join Settings section provides the following fields and buttons for creating joins:
- Description
-
Enter a description for your join.
- Internal name
-
DB2 Web Query assigns an alphanumeric name for the join, for example J001.
- Save & Create
-
Once you have selected your host and target fields, click Save & Create to create the join.
- View
-
Click to view the syntax of your join, which displays the code sent to the DB2 Web Query Reporting Server to validate the join, but may not be the same code required to run the report. This is the case for a DEFINE based JOIN where only the JOIN statement is displayed for validation, but both the JOIN and DEFINE statements are needed when the report is run.
The Join Type drop-down list provides the following join type options:
- Inner Join
-
A join that results when a report omits host rows that lack corresponding cross-referenced rows.
- Unspecified
-
Indicates neither an inner nor left outer join.
- Left Outer Join
-
Extends the results of an Inner Join and retrieves records from both host and cross-referenced tables, including all records from the left table (host) and any records from the right table (cross-referenced) where the condition values match. If there are no matching values in the cross-referenced table, the join still retrieves records from the host table.
The Instances drop-down list provides the following join instance options:
- Multiple Instance (formerly Non Unique)
-
A one-to-many join structure that matches one value in the host data source to multiple values in the cross-referenced field. Joining employee ID in a company's employee data source to employee ID in a data source that lists all the training classes offered by that company would result in a listing of all courses taken by each employee, or a joining of the one instance of each ID in the host file to the multiple instances of that ID in the cross-referenced file.
- Single Instance (formerly Unique)
-
A one-to-one join structure that matches one value in the host data source to one value in the cross-referenced data source. Joining an employee ID in an employee data source to an employee ID in a salary data source is an example of a unique join.
The Host Field List contains:
- Search (binoculars) icon
-
Opens the Field List Searching dialog box. See Searching Field Lists for details.
- Define icon
-
Click the Define icon to select: New define field, Edit define field, or Delete define field. If you select the New define field or Edit define field, the Define field creator dialog box opens where you can create or edit a defined field.
- Tree icon
-
Displays a tree structure of field names by segment with segment, alias, title, description, and format information below the tree. Individual field information appears when you click the field.
- List icon
-
Displays a list of all field names with information that you select from the adjacent arrow that opens a list box: name, alias, title, format, description, segment, and file name. You can also choose to sort by file order.
- Available fields
-
Lists of fields from the host data source for creating a join.
The Target Field List contains:
- Select a target button
-
Click to select a target Master File.
- Tree icon
-
Displays a tree structure of field names by segment with segment, alias, title, description, and format information below the tree. Individual field information appears when you click the field.
- List icon
-
Displays a list of all field names with information that you select from the adjacent arrow that opens a list box: name, alias, title, format, description, segment, and file name. You can also choose to sort by file order.
- Fields
-
Lists of fields from the target data source for creating a join.
For both the Host and Target field lists, each has its own Selected Fields window that has:
- Selected Fields window
-
Shows the fields selected from the data source for a join.
- Add icon
-
Adds a field.
- Remove icon
-
Removes a field.
- Move Up or Move Down icons
-
Moves the position of the field within the join.
Report Options Tab
The Report options tab is used to select options for a report.
Report Options Dialog Box
The following image shows the Report options tab where you select output formats for a report.
- Generate report as list box (when Show styled formats is selected)
-
When the Show styled formats option is selected from the drop-down list, choose from the following formats:
- Generate report as list box (when Show unstyled formats is selected)
-
When the Show unstyled formats option is selected from the drop-down list, choose from the following formats:
- EXCEL 95 - Excel 95
- DOC - Plain text with page breaks
- WP - Plain text without page breaks
- WK1
- Import to Lotus 1-2-3.
See Notes on Using LOTUS Format.
- DIF - Import to spreadsheet
- LOTUS - Import to Lotus 1-2-3.
See Notes on Using LOTUS Format.
- TABT - Tab-delimited
- XML - eXtensible Markup Language
- EXCEL 95 - Excel 95
- Generate report as list box (when Show database formats is selected)
-
When the Show database formats option is selected from the drop-down list, choose from the following formats:
When the Show database option is selected, the Database Output section becomes active.
- Show formats drop-down list
For styled formats, the Output format specific section has these options:
- Report title
-
Enter the report title in the text box.
- Format HTML Output
-
Full - Retains standard HTML formatting. This is the default.
Paged - Specifies that each page of a report is returned to the browser as a separate HTML table.
Fixed - Turns off HTML formatting and allows the report designer to determine where items in the report are placed.
- Optimize output with Cascading Style Sheets
-
Check to optimize output with Cascading Style Sheets.
- Use accessibility features (Section 508)
-
Check to use accessibility features (Section 508).
- Summary text for report
-
Add summary text in the text box. See Include Summary Text for a Report.
In the Interactive options subsection:
- Enable OLAP
- Automatic drill down
- On-demand paging
-
Check to initiate on-demand paging.
- Show pop-up field description
-
Check to display pop-up field descriptions for column titles. See Displaying Pop-up Field Descriptions for Column Titles.
The Global report styling section has these options:
- Font button
- Opens the font styling dialog box.
- Font
-
Select from the list box.
- Style
-
Select from normal or bold, italic, underline, and various combinations.
- Size
-
Select a font size from the list box.
- Text color
-
Select a color from the color palette.
- Background color
-
Select a color from the color palette.
- Justification
-
Select left, right, or center from the list box.
- Active Report Styling
-
Opens the Active Report Styling dialog box. This button is only active when you select the AHTML - Active Report output format. See Creating an HTML Active Report.
- Apply an existing Style Sheet
-
Select None or a Style Sheet from the list box.
- Apply an existing Cascading Style Sheet
-
Select None or a Style Sheet from the list box.
The Send to printer check box allows you to send your output directly to a designated printer.
The Content and generation section has these options:
- Page numbering
-
Select Default, On, Off, or No lead from the list box.
- Limit the number of read operations performed during report generation
-
Enter a number in the text box.
- Stop retrieving reports after the specified number have been included in the report
-
Enter a number in the text box.
- Use Database Optimization
- Enables the database to use its internal optimization techniques which reduce the volume of database-to-server communications and improve response time.
The Database Output section has these options:
- Destination Library
-
Enter name of the library destination for the DB2 report file.
- Name
-
Enter the name of the DB2 file.
- Overwrite existing file
-
Select this option if overwrite an existing file.
When specifying to overwite an existing database file, the file will not be overwritten if you do not have specific write authority to the file. A message will be displayed which says that the file already exists, even though overwrite was specified.
The Printer section has one option:
- Name
- Enable when the Send to printer check box is selected. Enter the name of the printer.
Notes on Using Lotus Format
The Display Format selection box on the Report options tab lists Lotus as a display format. This format, however, does not create a valid Lotus™ spreadsheet. To work around this limitation, follow these steps: