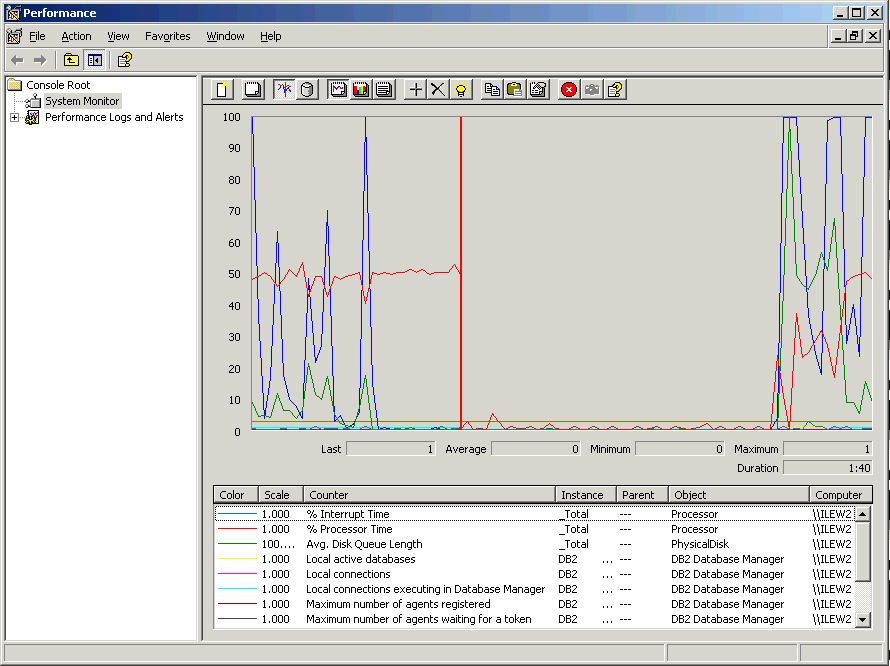
Windows® operating systems provide a useful tool for monitoring the performance of your DB2® applications. The Performance Monitor, which is one of the Windows administrative tools, displays a graphical representation of system performance. You can choose a variety of system, database, and communications-related items to monitor and map them together in a graphical representation.
For example, the reports available through the GET SNAPSHOT FOR ALL DCS DATABASES or GET SNAPSHOT FOR ALL DCS APPLICATIONS commands can be graphed in real time using the monitor, and compared directly with values such as CPU usage. You can directly compare the effects of different settings on database or communications performance. You can save your specialized configurations of settings in PMC files that you can later retrieve.
For example in the figure below, several DB2 measures are being graphed against CPU usage. The collection of values being charted was saved in the file db2chart.pmc. You can save as many PMC files as you like, each reflecting a different cross-section of system performance.
Figure 1. Performance Monitor
To enable monitoring of local applications you will need to turn off the DB2CONNECT_IN_APP_PROCESS environment variable.