Performance is the way a computer system behaves given a particular workload. It is affected by the available resources and how they are used and shared. If you want to improve performance, first decide what you mean by performance. You can choose many different performance metrics, including:
Performance will be limited by the available hardware and software resources. CPU, memory, and network adapters are examples of hardware resources. Communication subsystems, paging subsystems, mbuf for AIX®, is an example of a software resource.
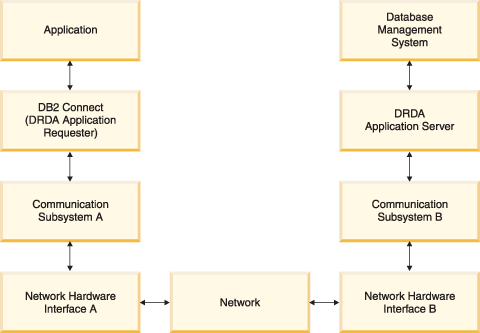
Figure 1 shows the path of data flowing between the host or System i database server and the workstation through DB2 Connect.
Figure 1. Data Flows in DB2 Connect
Transaction throughput is dependent on the slowest component in the system. If you identify a performance bottleneck, you can often alleviate the problem by changing configuration parameters, allocating more resources to the problem component, upgrading the component, or adding a new component to off-load some of the work.
You can use various tools to determine how much time a query spends in each component. This will give you an idea of which components should be tuned or upgraded to improve performance. For example, if you determine that a query spends 60% of its time in the DB2 Connect machine, you might want to tune DB2 Connect or (if you have remote clients) add another DB2 Connect machine to the network.
Benchmarking compares performance in one environment with performance in another. Benchmarking can begin by running the test application in a normal environment. As a performance problem is narrowed down, specialized test cases can be developed to limit the scope of the function that is tested and observed.
Benchmarking does not need to be complex. Specialized test cases need not emulate an entire application in order to obtain valuable information. Start with simple measurements and increase the complexity only when warranted.
Characteristics of good benchmarks:Note: Applications that are started use memory even when they are minimized or idle. This could cause paging and skew the results of the benchmark.
The following tables list some of the tools that can help you measure system performance. Because these tools themselves use system resources, you might not want to have them active all the time.
| System | Tool | Description |
|---|---|---|
| AIX | vmstat, time, ps, tprof | Provide information about CPU or memory contention problems on the DB2 Connect workstation and remote clients. |
| HP-UX | vmstat, time, ps, monitor and glance if available | |
| Windows® | Microsoft® Performance Monitor |
| System | Tool | Description |
|---|---|---|
| All | Database monitor | Determines if the problem originates from the database. |
| OS/390® or zSeries® | DB2PM (IBM®), OMEGAMON/DB2 (Candle®), TMON (Landmark), INSIGHT (Goal Systems) and DB2AM (BMC) | |
| Windows | Microsoft Performance Monitor |
| System | Tool | Description |
|---|---|---|
| AIX | netpmon | Reports low level network statistics, including TCP/IP statistics such as the number of packet or frames received per second. |
| Network controller such as 3745 | NetView® Performance Monitor | Reports utilization of communication control and VTAM®. |
| Linux® and UNIX® | netstat | Handles TCP/IP traffic. |