3.8.3 Monitor with the Tivoli Performance Viewer
TPV can monitor PMI metrics for items such as...
- memory usage
- thread and connection pool utilization
WXS adds additional PMI metrics for...
Sizing Number of entries and size of map Cache statistics Cache retrievals and hit rates Performance Retrieval response times
You can leverate PMI only when using WXS with WAS. Stand-alone WXS deployments use the WXS web console.
Enable WXS PMI modules
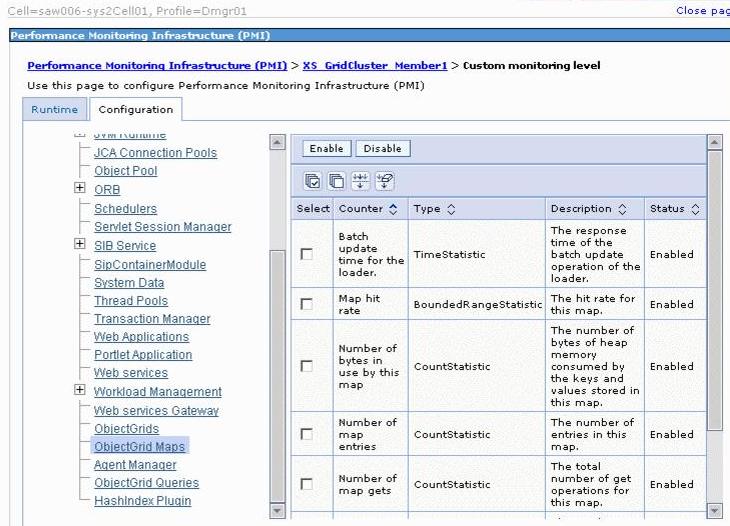
By default, TPV does not show all PMI statistics. To see the statistics for the grid, enable the ObjectGrid and ObjectGrid Maps modules for each of the grid cluster members...
- In the administrative console for the WebSphere process hosting the WXS grid, click...
Monitor and Tuning | Performance Monitoring Infrastructure (PMI)
- Click the grid container server, for example...
XS_GridCluster_Member1
- Select...
Enable Performance Monitoring Infrastructure
- Click...
Custom | ObjectGrids | ObjectGrid counters | Enable

- Click...
ObjectGrid Maps | ObjectGrid Map counters | Enable
- Save the changes.
- Synchronize the node and restart the grid cluster.
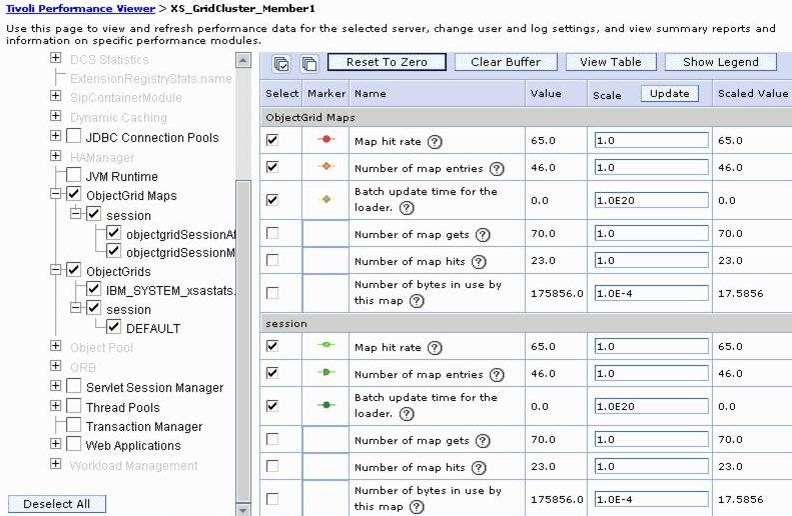
After the PMI statistics for WXS have been enabled, you can see grid counters in TPV.
Use TPV to view grid counters
- In the administrative console, click...
Monitoring and Tuning | Performance Viewer | Current Activity | server(s) | Start Monitoring
- Click a monitored server to open TPV for that server.
- Expand Performance Modules on the left side and select the modules under ObjectGrids and ObjectGrid Maps that to view.
- When the view refreshes, the performance statistics display.